Negativity Bias and Engagement on Hacker News
This Hacker News sentiment analysis began with a simple observation: posts with negative sentiment average 35.6 points on Hacker News. The overall average is 28 points. That’s a 27% performance premium for negativity.
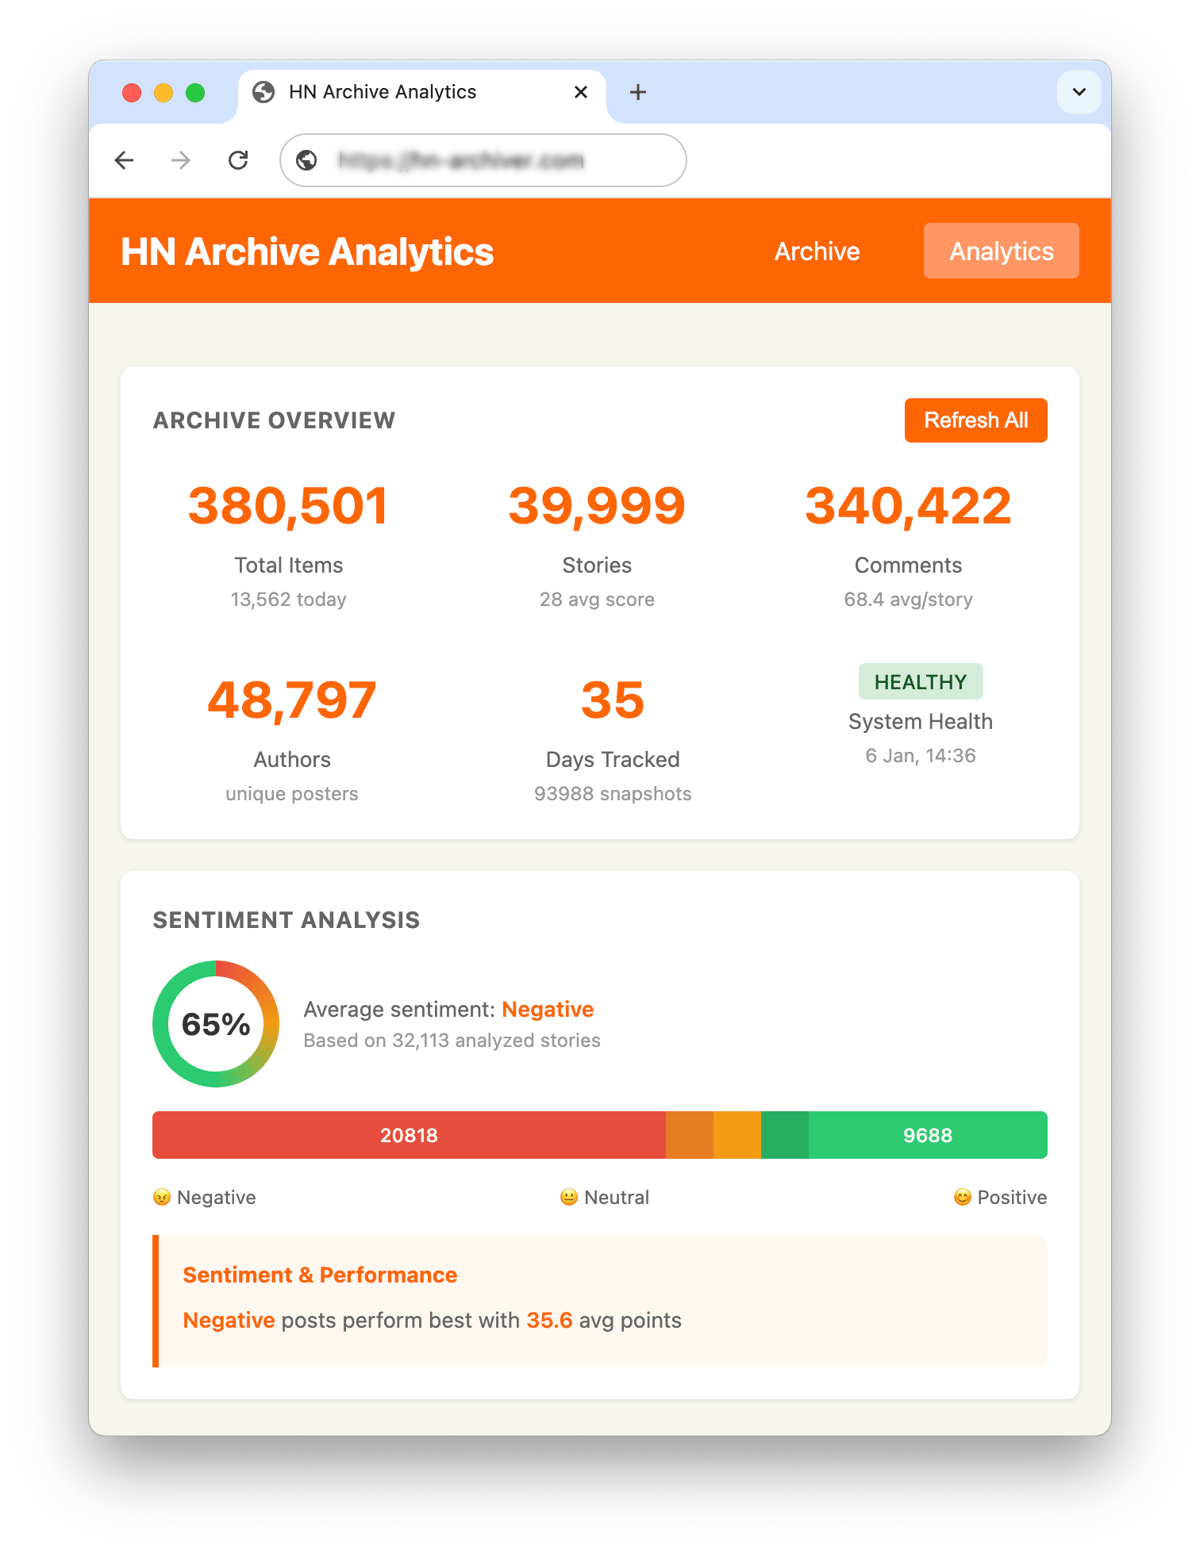
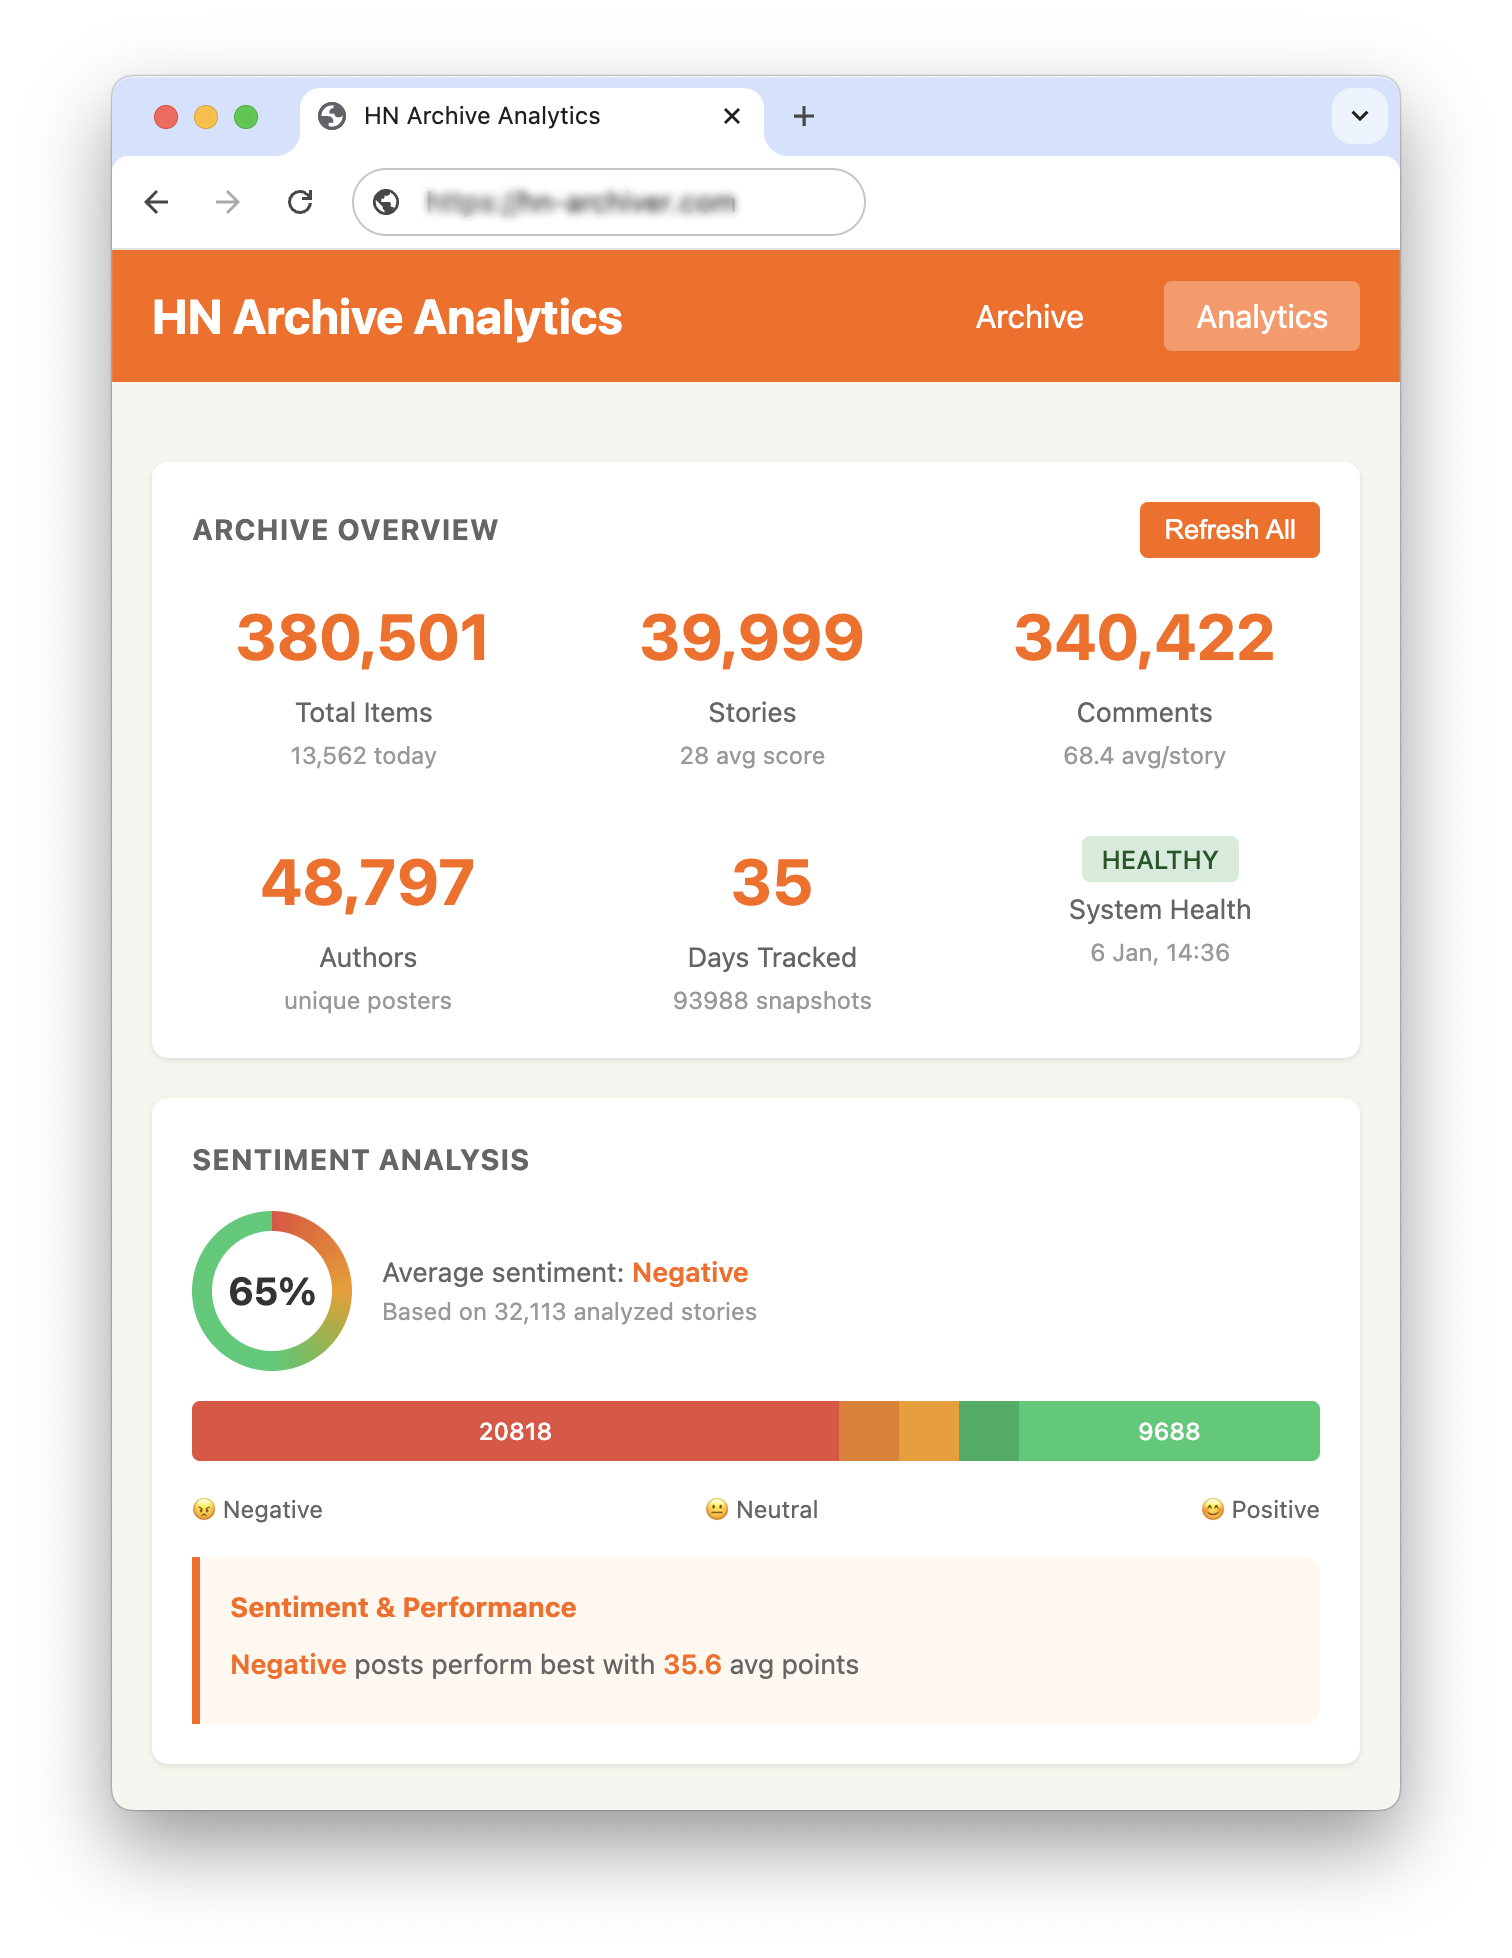
This finding comes from an empirical study I’ve been running on HN attention dynamics, covering decay curves, preferential attachment, survival probability, and early-engagement prediction. The preprint is available on SSRN. I already had a gut feeling. Across 32,000 posts and 340,000 comments, nearly 65% register as negative. This might be a feature of my classifier being miscalibrated toward negativity; yet the pattern holds across six different models.
Six-Model Sentiment Comparison: Transformers vs LLMs
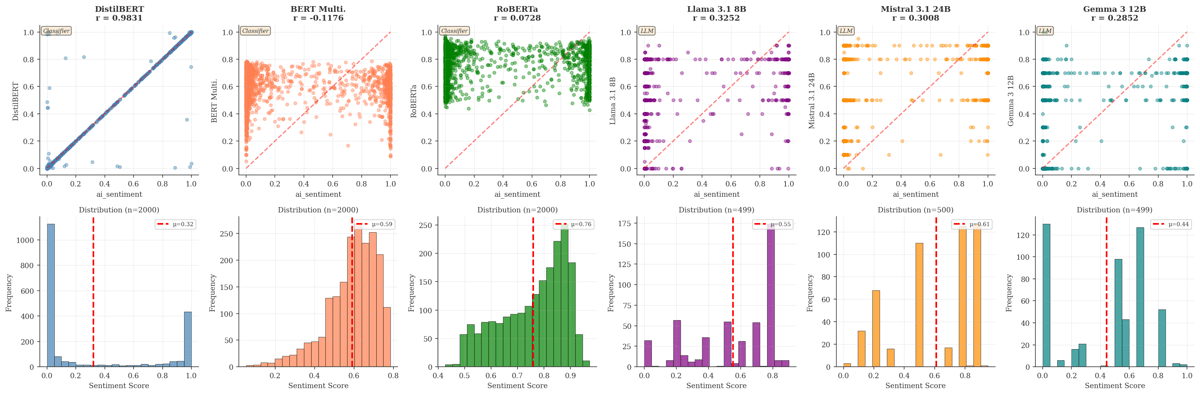
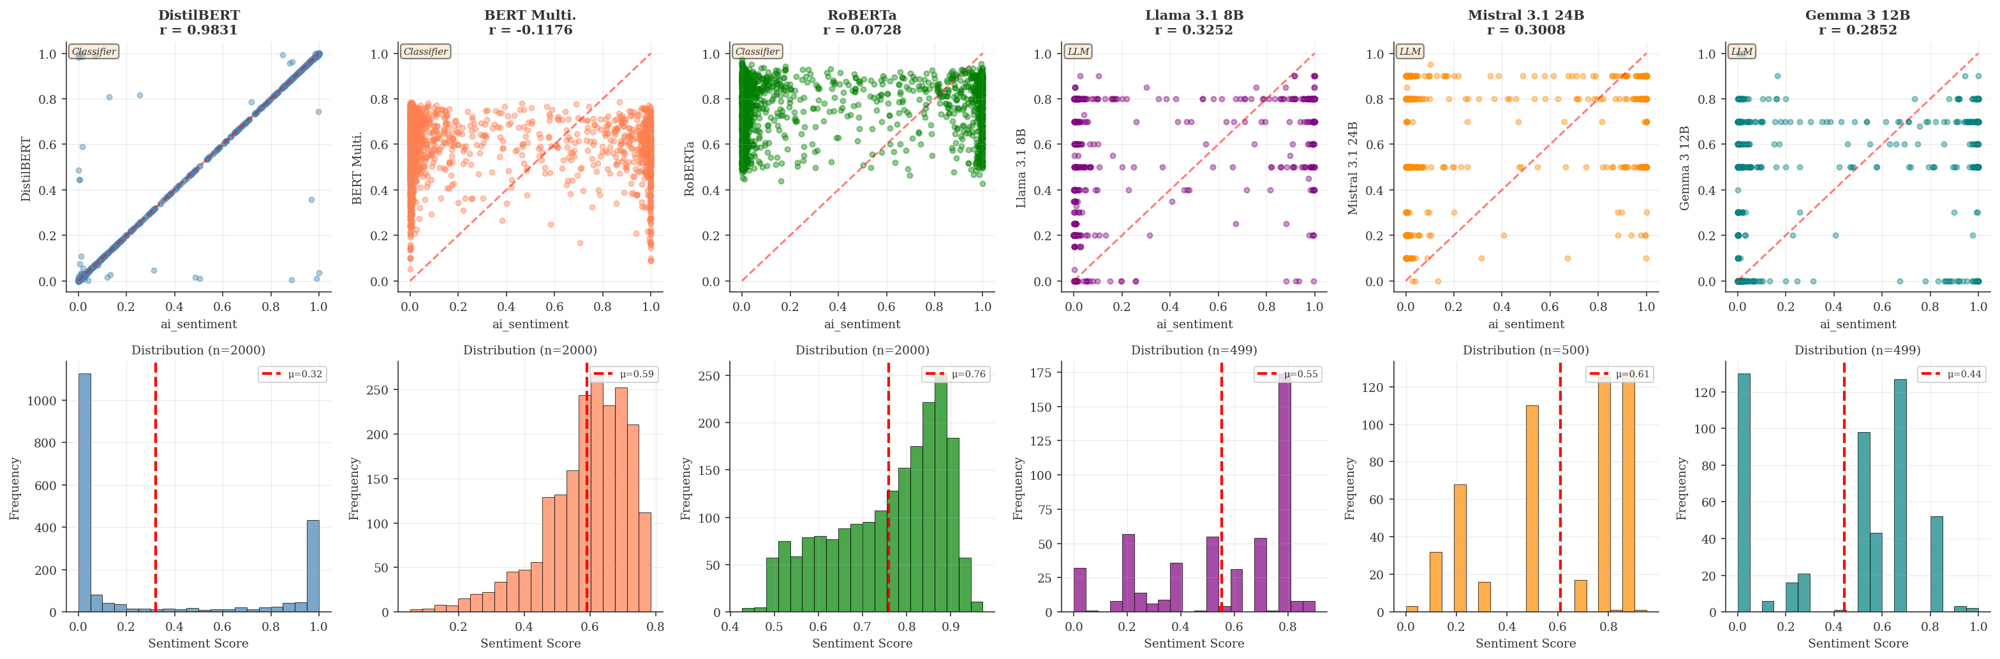
I tested three transformer-based classifiers (DistilBERT, BERT Multi, RoBERTa) and three LLMs (Llama 3.1 8B, Mistral 3.1 24B, Gemma 3 12B). The distributions vary, but the negative skew persists across all of them (inverted scale for 2-6). The results I use in my dashboard are from DistilBERT because it runs efficiently in my Cloudflare-based pipeline.
What counts as “negative” here? Criticism of technology, skepticism toward announcements, complaints about industry practices, frustration with APIs. The usual. It’s worth noting that technical critique reads differently than personal attacks; most HN negativity is substantive rather than toxic. But, does negativity cause engagement, or does controversial content attract both negative framing and attention? Probably some of both.
HackerBook Dataset: Cross-Validation With 22GB of Hacker News Data
Related to this, I also saw this Show HN: 22GB of Hacker News in SQLite, served via WASM shards. Downloaded the HackerBook export and ran a subset of my paper’s analytics on it.
Caveat: HackerBook is a single static snapshot (no time-series data). Therefore I could not analyze lifecycle analysis, early-velocity prediction, or decay fitting. What can be computed: distributional statistics, inequality metrics, circadian patterns.
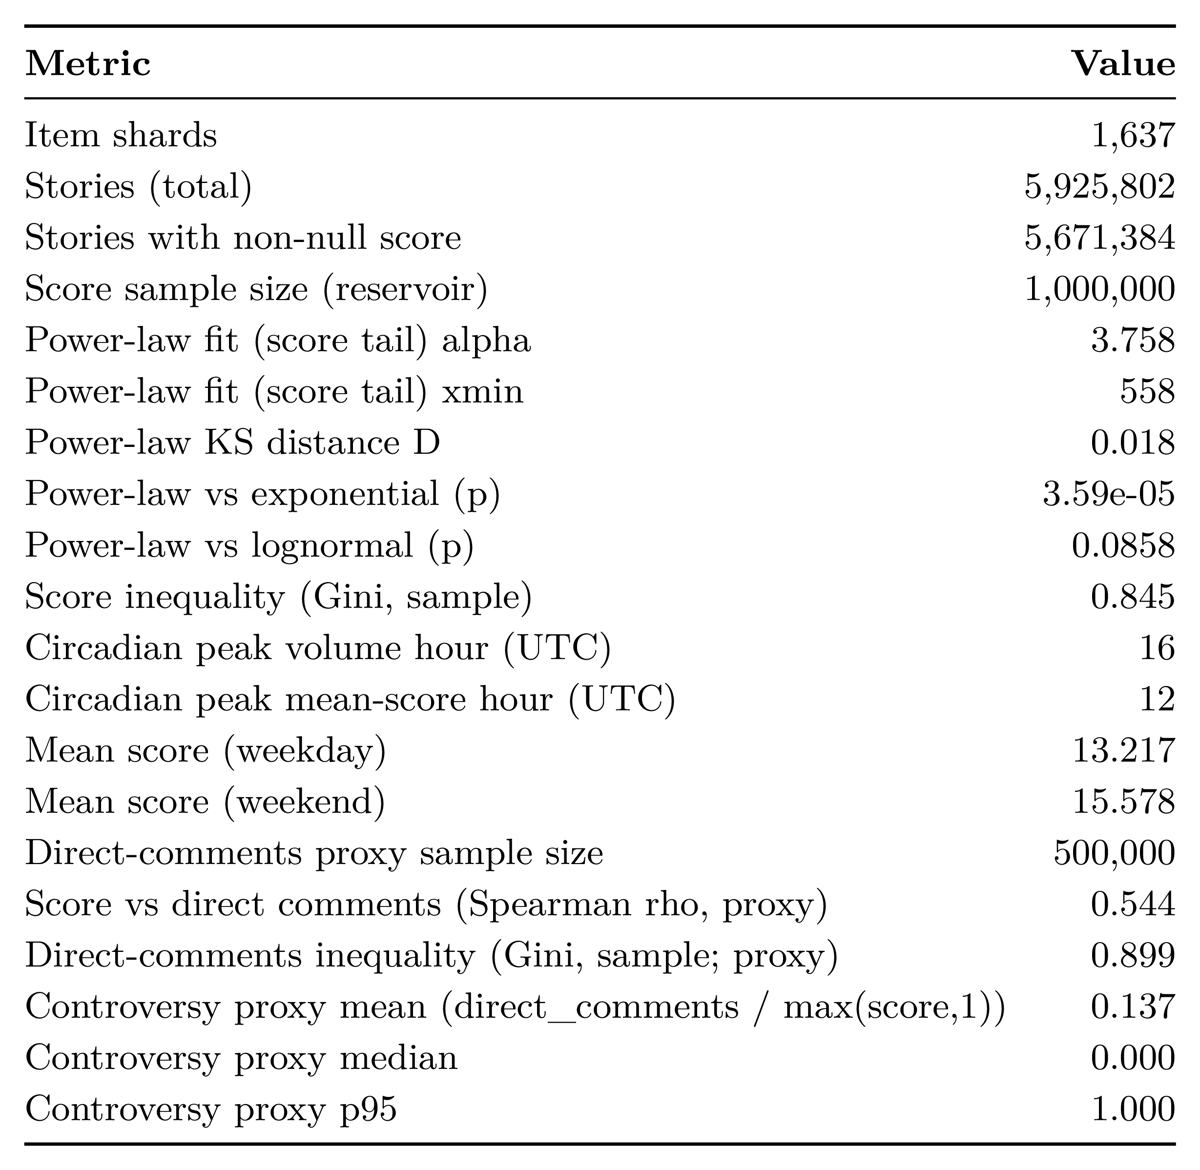

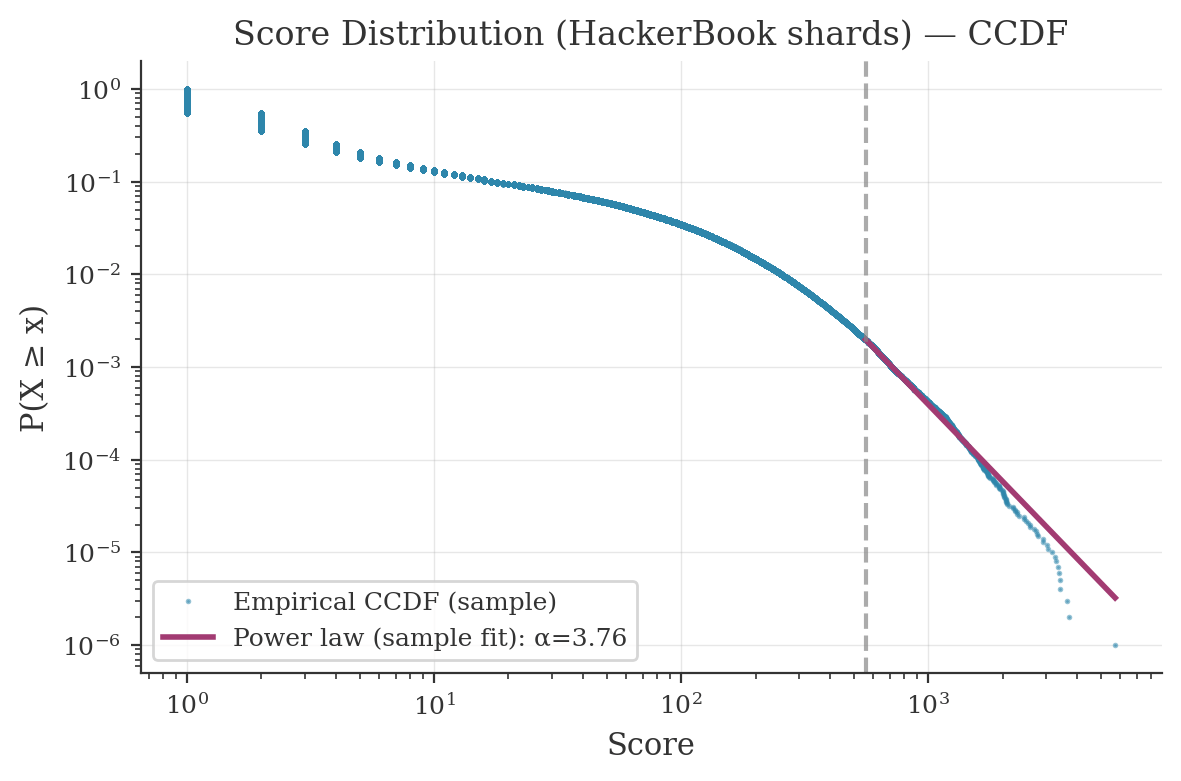
Score Distribution and Power-Law Fit

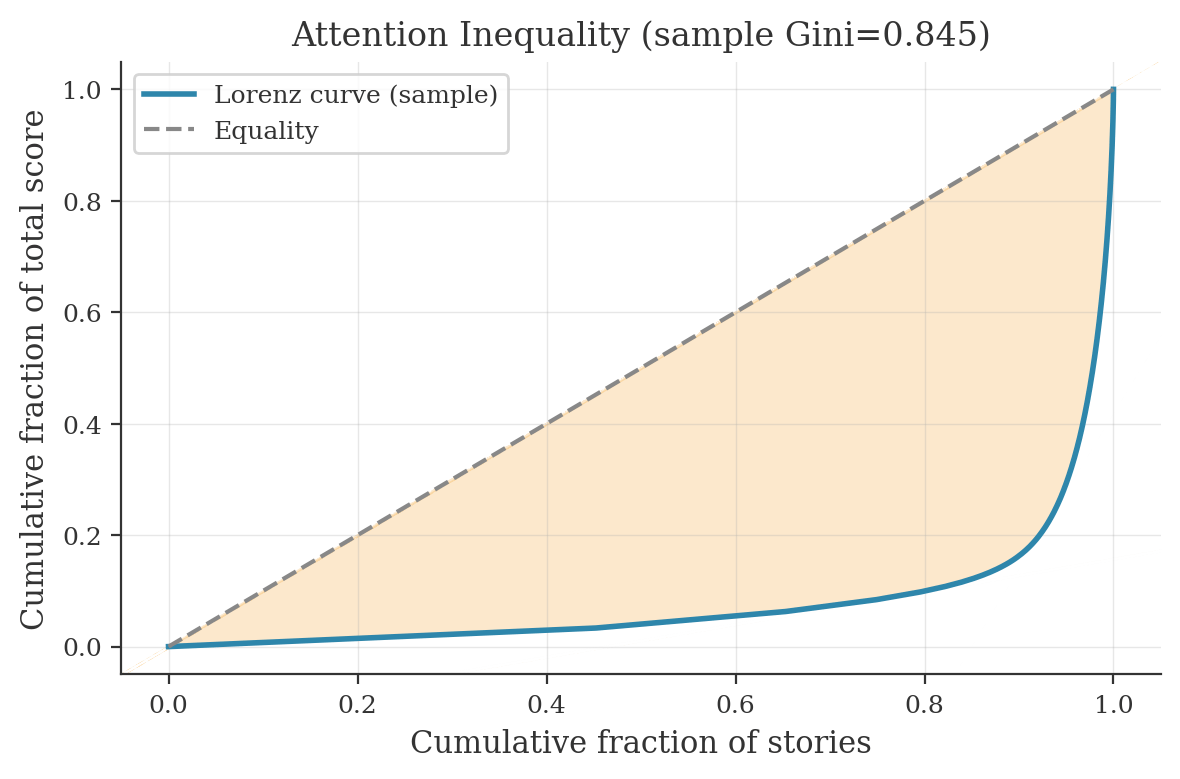
Attention Inequality: Lorenz Curve and Gini Coefficient

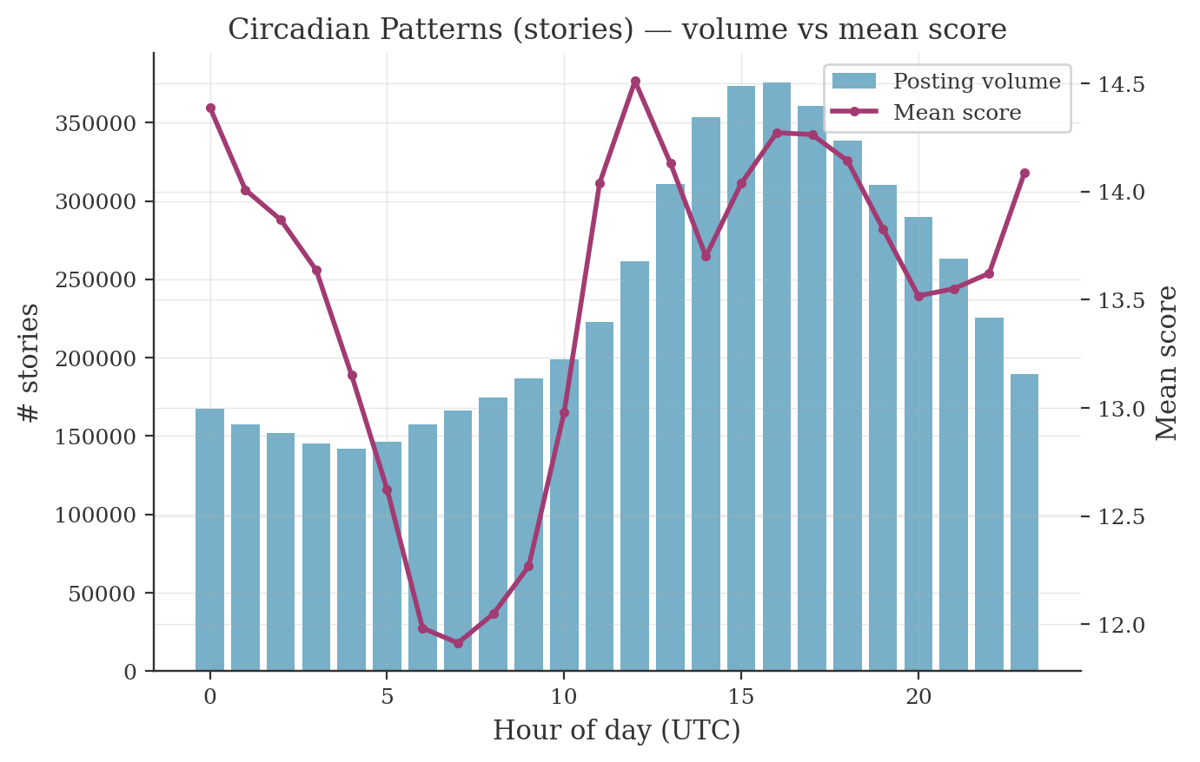
Circadian Posting Patterns

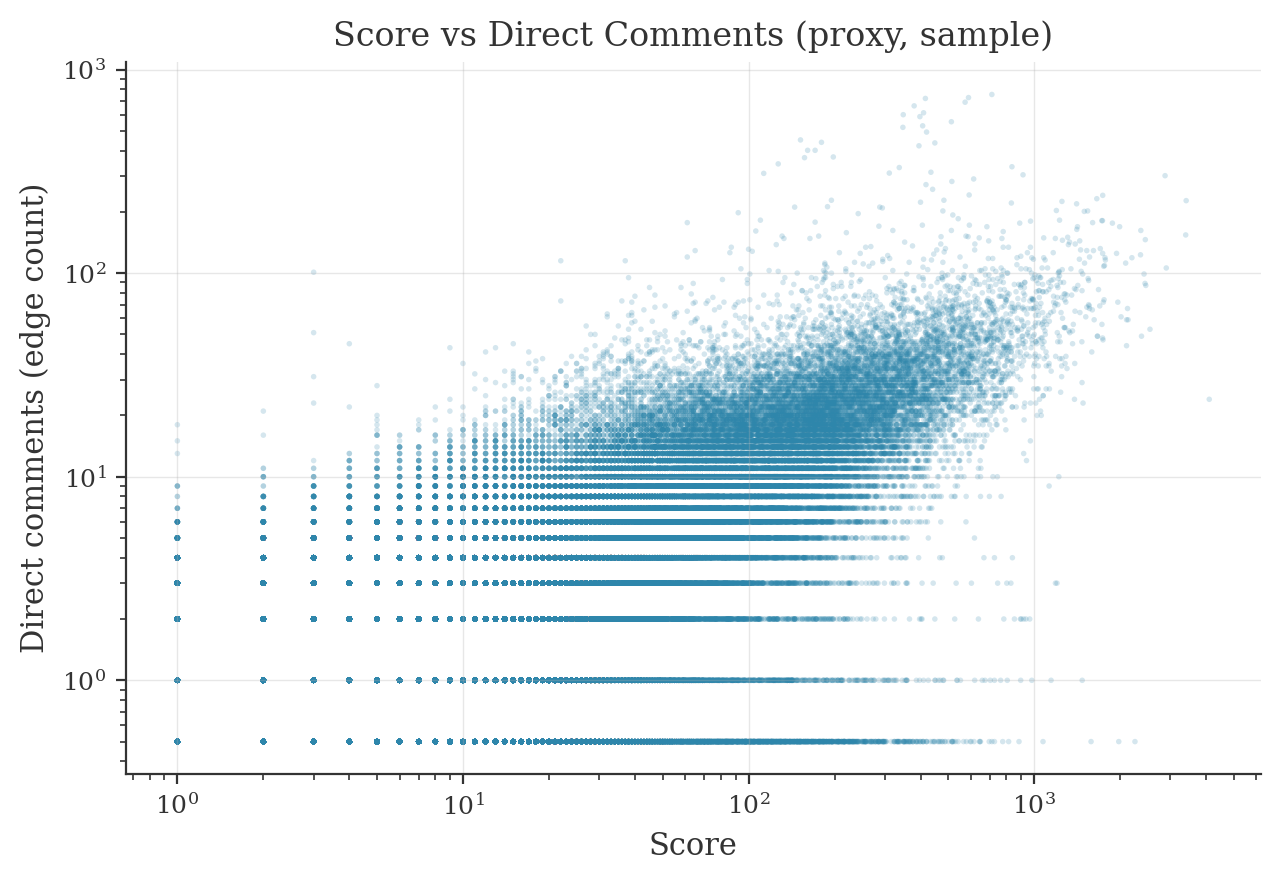
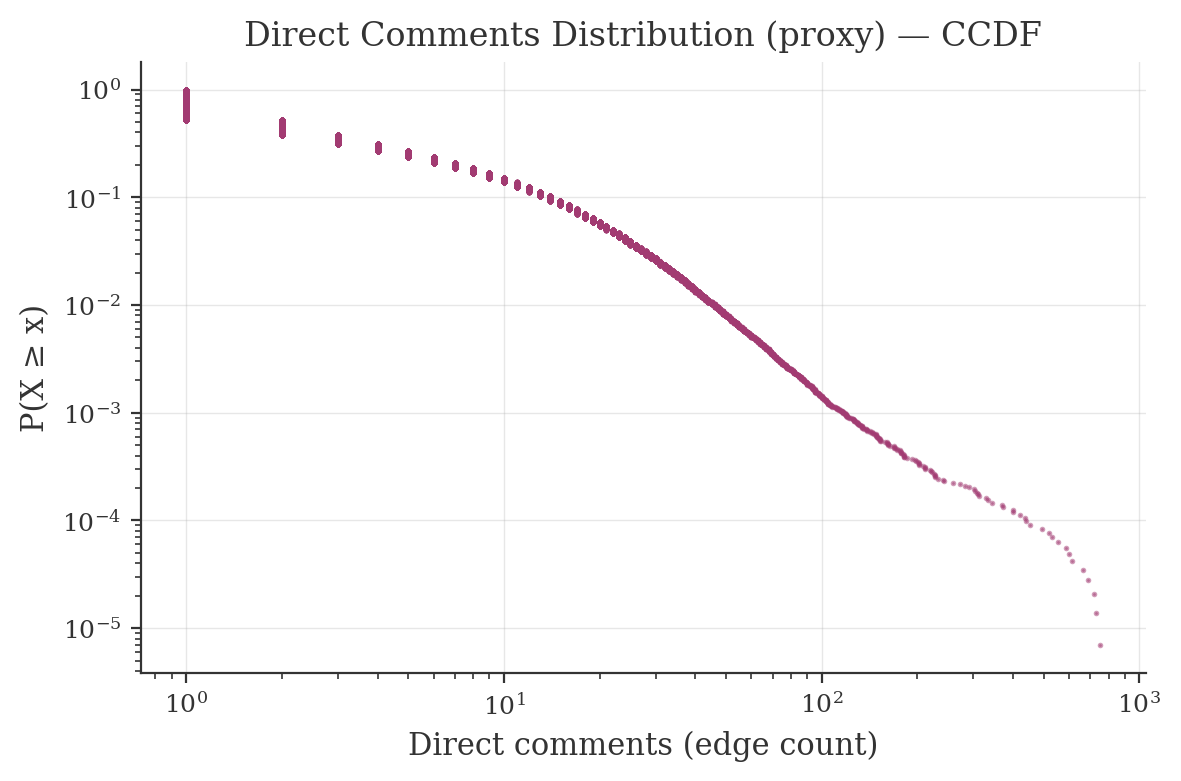
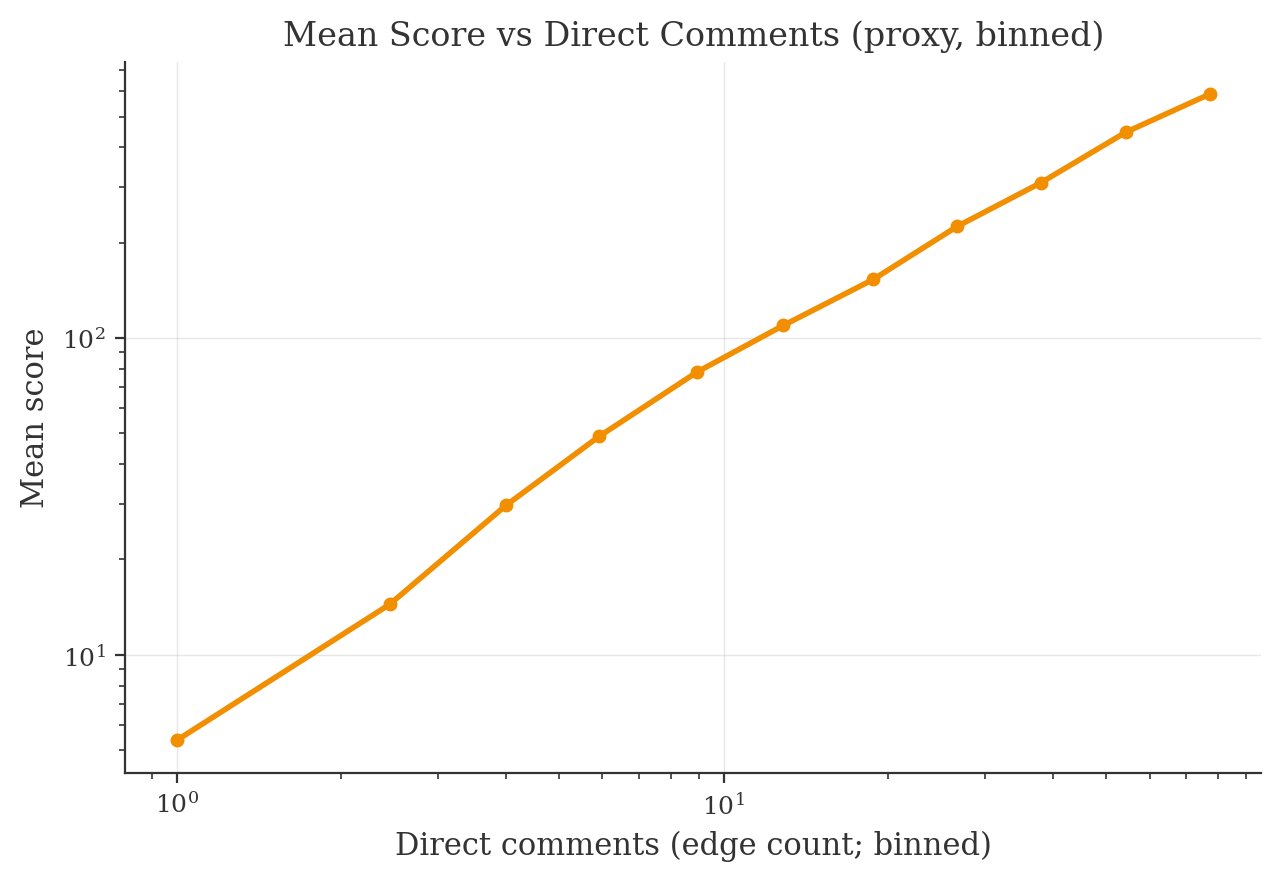
Score vs Comment Engagement