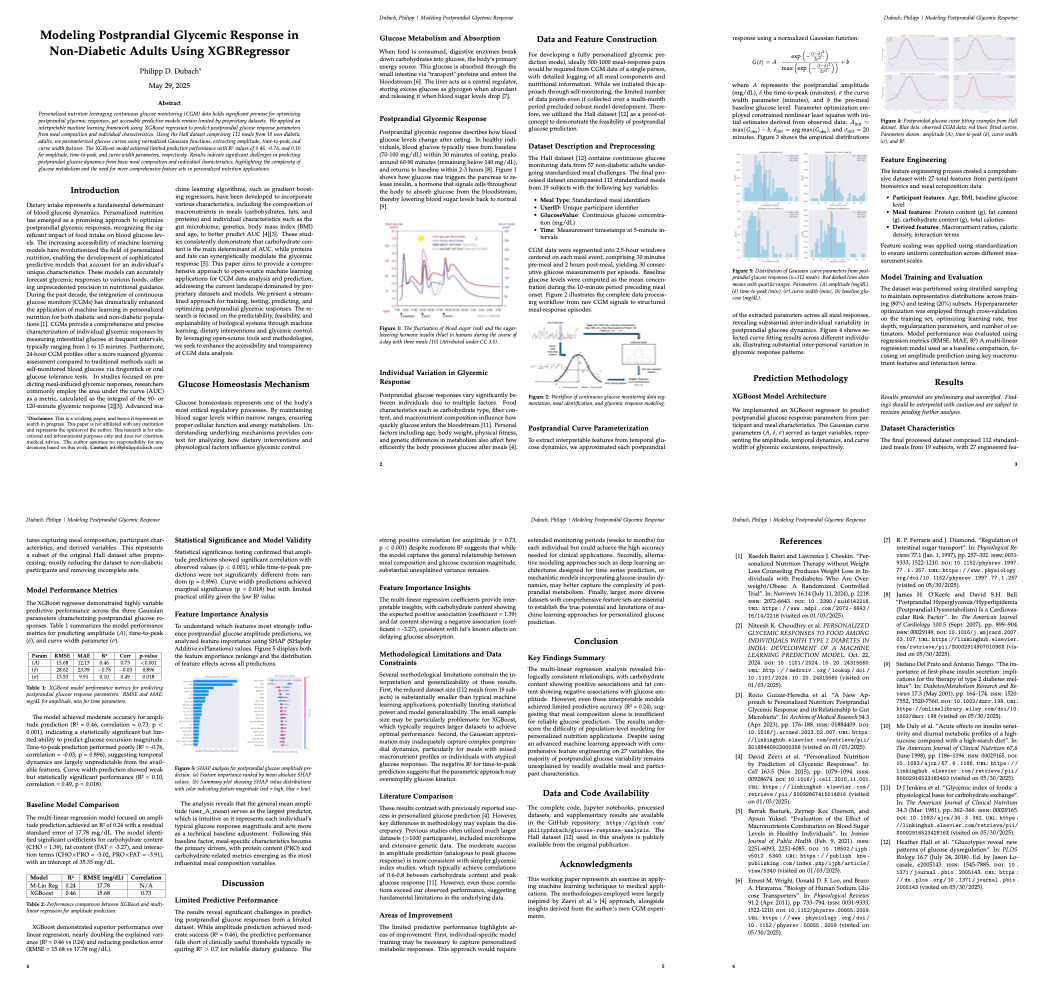
Earlier this year I wrote how I built a CGM data reader after wearing a continuous glucose monitor myself. Since I was already logging my macronutrients and learning more about molecular biology in an MIT MOOC I became curious if given a meal’s macronutrients (carbs, protein, fat) and some basic individual characteristics (age, BMI), these could serve as features in a regressor machine learning model to predict the curve parameters of the postprandial glucose curve (how my blood sugar levels change after eating). I came across a paper on Personalized Nutrition by Prediction of Glycemic Responses which did exactly that. Unfortunately, neither the data nor the code were publicly available. And - I wanted to predict my own glycemic response curve. So I decided to build my own model. In the process I wrote this working paper.

 The paper represents an exercise in applying machine learning techniques to medical applications. The methodologies employed were largely inspired by Zeevi et al.’s approach. I quickly realized that training a model on my own data only was not very promising if not impossible. To tackle this, I used the publicly available Hall dataset containing continuous glucose monitoring data from 57 adults, which I narrowed down to 112 standardized meals from 19 non-diabetic subjects with their respective glucose curve after the meal (full methodology in the paper).

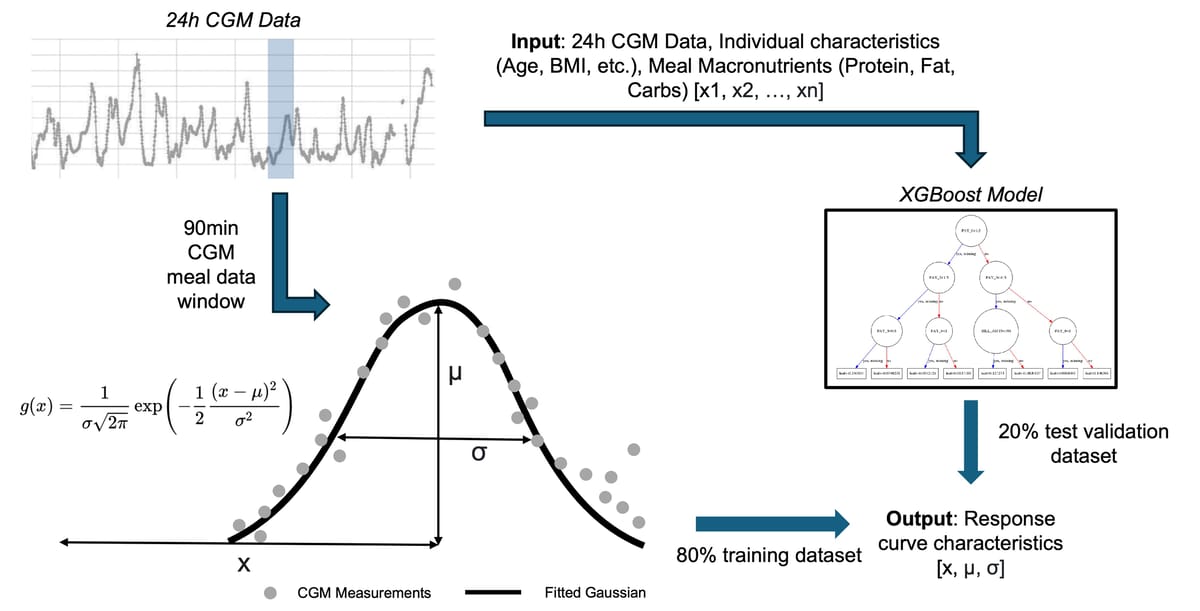
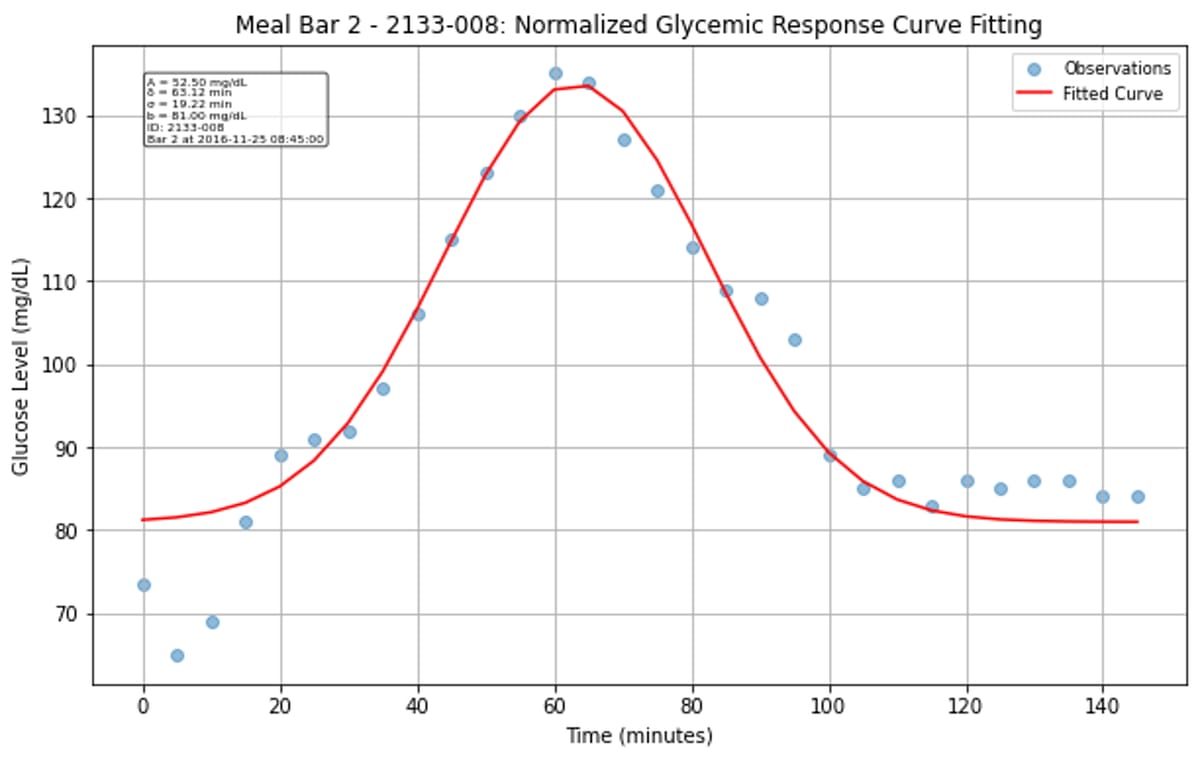
 Rather than trying to predict the entire glucose curve, I simplified the problem by fitting each postprandial response to a normalized Gaussian function. This gave me three key parameters to predict: amplitude (how high glucose rises), time-to-peak (when it peaks), and curve width (how long the response lasts).

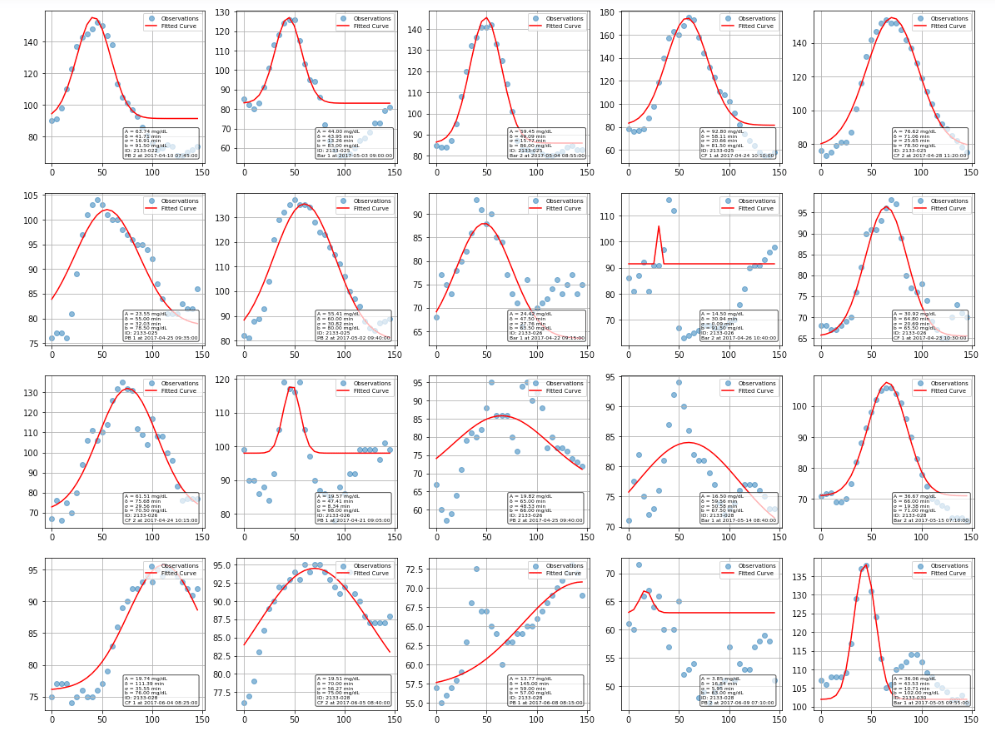
 The Gaussian approximation worked surprisingly well for characterizing most glucose responses. While some curves fit better than others, the majority of postprandial responses were well-captured, though there’s clear variation between individuals and meals. Some responses were high amplitude, narrow width, while others are more gradual and prolonged.

 I then trained an XGBoost regressor with 27 engineered features including meal composition, participant characteristics, and interaction terms. XGBoost was chosen for its ability to handle mixed data types, built-in feature importance, and strong performance on tabular data. The pipeline included hyperparameter tuning with 5-fold cross-validation to optimize learning rate, tree depth, and regularization parameters. Rather than relying solely on basic meal macronutrients, I engineered features across multiple categories and implemented CGM statistical features calculated over different time windows (24-hour and 4-hour periods), including time-in-range and glucose variability metrics. Architecture wise, I trained three separate XGBoost regressors - one for each Gaussian parameter.
While the model achieved moderate success predicting amplitude (R² = 0.46), it completely failed at predicting timing - time-to-peak prediction was essentially random (R² = -0.76), and curve width prediction was barely better (R² = 0.10). Even the amplitude prediction, while statistically significant, falls well short of an R² > 0.7. Studies that have achieved better predictive performance typically used much larger datasets (>1000 participants). For my original goal of predicting my own glycemic responses, this suggests that either individual-specific models trained on extensive personal data, or much more sophisticated approaches incorporating larger training datasets, would be necessary.
The complete code, Jupyter notebooks, processed datasets, and supplementary results are available in my GitHub repository.
_ _
(10/06/2025) Update: Today I came across Marcel Salathé’s LinkedIn post on a publication out of EPFL: Personalized glucose prediction using in situ data only.
With data from over 1,000 participants of the Food & You digital cohort, we show that a machine learning model using only food data from myFoodRepo and a glucose monitor can closely track real blood sugar responses to any meal (correlation of 0.71).
As expected Singh et. al. achieve a substantially better predictive performance (R = 0.71 vs R² = 0.46). Besides probably higher methodological rigor and scientific quality, the most critical difference is sample size - their 1'000+ participants versus my 19 participants (from the Hall dataset) represents a fundamental difference in statistical power and generalizability. They addressed one of the shortcomings I faced by leveraging a large digital nutritional cohort from the “Food & You” study (including high-resolution data of nutritional intake of more than 46 million kcal collected from 315'126 dishes over 23'335 participant days, 1'470'030 blood glucose measurements, 49'110 survey responses, and 1'024 samples for gut microbiota analysis).
Apart from that I am excited to - at a first glance - observe the following similarities: (1) Both aim to predict postprandial glycemic responses using machine learning, with a focus on personalized nutrition applications. (2) Both employ XGBoost regression as their primary predictive algorithm and use similar performance metrics (R², RMSE, MAE, Pearson correlation). (3) Both extract comprehensive feature sets including meal composition (macronutrients), temporal features, and individual characteristics. (4) Both use mathematical approaches to characterize glucose responses - I used Gaussian curve fitting, while Singh et. al. use incremental area under the curve (iAUC). (5) Both employ cross-validation techniques for model evaluation and hyperparameter tuning. (6) SHAP Analysis: Both use SHAP for model interpretability and feature importance analysis.