# Against All Odds: The Mathematics of 'Provably Fair' Casino Games

**Author:** Philipp D. Dubach | **Published:** January 25, 2026 | **Updated:** February 23, 2026
**Categories:** Quantitative Finance
**Keywords:** provably fair gambling, crash game mathematics, RTP statistical testing, gambling house edge, crash game strategy

## Key Takeaways

- Statistical analysis of 20,000 crash game rounds confirms the 97% RTP claim: the estimated probability exponent is 1.98 versus a theoretical 2.0, within 2.2% accuracy
- At 179 rounds per hour with 16-second median intervals and a 3% house edge per round, players face expected losses exceeding 500% of amounts wagered per hour
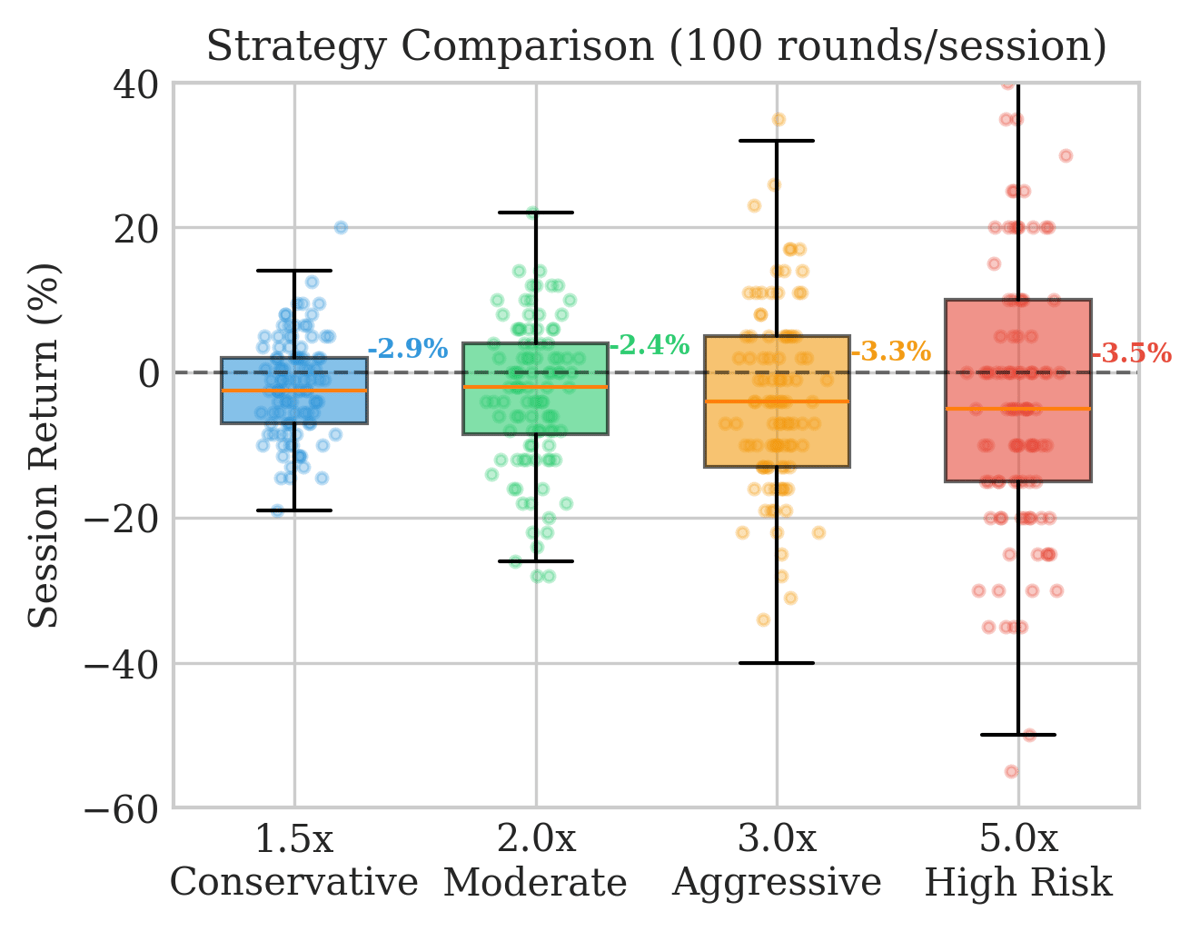
- Monte Carlo simulations of 10,000 sessions across four strategies (1.5x to 5x cash-outs) confirm every single strategy produces negative expected returns
- The probability of reaching multiplier m before crashing equals 0.97/m, so a 2x target succeeds 48.5% of the time while 100x works just 1.1% of rounds

---


<br>

>Gambling can be harmful and lead to significant losses. Participation is subject to local laws and age restrictions. Always gamble responsibly. Need help? Visit BeGambleAware.org

<br>

Crash games represent a category of online gambling where players place bets on an increasing multiplier that can _'crash'_ at any moment. The fundamental mechanic requires players to cash out before the crash occurs; successful cash-outs yield the bet amount multiplied by the current multiplier, while failure results in total loss of the wager.

<a href="#lightbox-flight-game-gif-0" style="display: block; width: 80%; margin: 0 auto; padding: 1.5rem 0; text-decoration: none;">
  <picture class="img-lightbox">
    
    <source media="(max-width: 768px)" 
            srcset="https://static.philippdubach.com/cdn-cgi/image/width=320,quality=80,format=webp/flight-game.gif 320w,
                    https://static.philippdubach.com/cdn-cgi/image/width=480,quality=80,format=webp/flight-game.gif 480w,
                    https://static.philippdubach.com/cdn-cgi/image/width=640,quality=80,format=webp/flight-game.gif 640w,
                    https://static.philippdubach.com/cdn-cgi/image/width=960,quality=80,format=webp/flight-game.gif 960w,
                    https://static.philippdubach.com/cdn-cgi/image/width=1200,quality=80,format=webp/flight-game.gif 1200w"
            sizes="80vw">
    
    
    <source media="(max-width: 1024px)" 
            srcset="https://static.philippdubach.com/cdn-cgi/image/width=768,quality=80,format=webp/flight-game.gif 768w,
                    https://static.philippdubach.com/cdn-cgi/image/width=1024,quality=80,format=webp/flight-game.gif 1024w,
                    https://static.philippdubach.com/cdn-cgi/image/width=1440,quality=80,format=webp/flight-game.gif 1440w"
            sizes="80vw">
    
    
    <source media="(min-width: 1025px)" 
            srcset="https://static.philippdubach.com/cdn-cgi/image/width=1200,quality=80,format=webp/flight-game.gif 1200w,
                    https://static.philippdubach.com/cdn-cgi/image/width=1600,quality=80,format=webp/flight-game.gif 1600w,
                    https://static.philippdubach.com/cdn-cgi/image/width=2000,quality=80,format=webp/flight-game.gif 2000w"
            sizes="80vw">
    
    
    <img src="https://static.philippdubach.com/cdn-cgi/image/width=1200,quality=80/flight-game.gif" 
         alt="Crash game showing an airplane flying with increasing multiplier until it crashes" 
         class=""
         width="1200"
         height="630"
         loading="lazy"
         decoding="async"
         style="width: 100%; height: auto; display: block;">
  </picture>
</a>


The specific game I came across is a variant that employs an aircraft flight metaphor. Let's call it _Plane Game_. What intrigued me wasn't the game itself but that it said "provably fair" on the startup screen, which I assumed to be a typo at first. I stand corrected:

>A provably fair gambling system uses cryptography to let players verify that each outcome was generated from fixed inputs, rather than chosen or altered by the operator after a bet is placed. The casino commits to a hidden "server seed" via a public hash, combines it with a player-controlled "client seed" and a per-bet nonce, and later reveals the server seed so anyone can recompute and confirm the result.

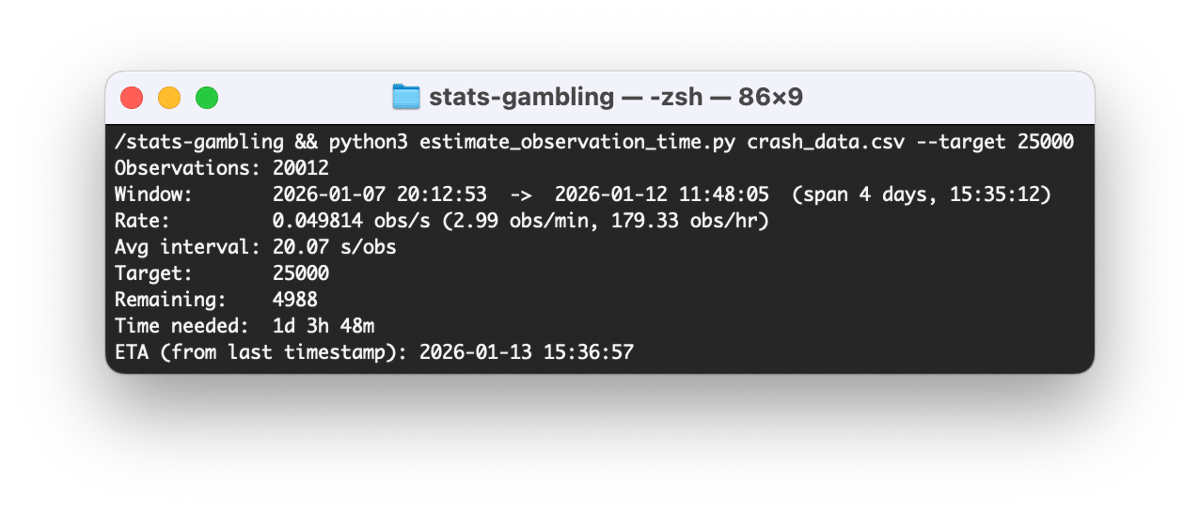
The stated Return-to-Player (RTP) of that specific game is 97%, implying a 3% [house edge](https://www.investopedia.com/articles/personal-finance/110415/why-does-house-always-win-look-casino-profitability.asp). After watching a few rounds, the perceived probability felt off. And if there's something that gets my attention, it's [the combination of games and statistics](/posts/counting-cards-with-computer-vision/). So I did what any reasonable person would do: I watched another 20,000 rounds over six days (112 hours total) and wrote [a paper about it](https://static.philippdubach.com/pdf/202601_PD_DUBACH_The%20Online%20Gambling%20Fairness%20Paradox.pdf).<a href="#lightbox-crash_game_stats-png-1" style="display: block; width: 80%; margin: 0 auto; padding: 1.5rem 0; text-decoration: none;">
  <picture class="img-lightbox">
    
    <source media="(max-width: 768px)" 
            srcset="https://static.philippdubach.com/cdn-cgi/image/width=320,quality=80,format=webp/crash_game_stats.png 320w,
                    https://static.philippdubach.com/cdn-cgi/image/width=480,quality=80,format=webp/crash_game_stats.png 480w,
                    https://static.philippdubach.com/cdn-cgi/image/width=640,quality=80,format=webp/crash_game_stats.png 640w,
                    https://static.philippdubach.com/cdn-cgi/image/width=960,quality=80,format=webp/crash_game_stats.png 960w,
                    https://static.philippdubach.com/cdn-cgi/image/width=1200,quality=80,format=webp/crash_game_stats.png 1200w"
            sizes="80vw">
    
    
    <source media="(max-width: 1024px)" 
            srcset="https://static.philippdubach.com/cdn-cgi/image/width=768,quality=80,format=webp/crash_game_stats.png 768w,
                    https://static.philippdubach.com/cdn-cgi/image/width=1024,quality=80,format=webp/crash_game_stats.png 1024w,
                    https://static.philippdubach.com/cdn-cgi/image/width=1440,quality=80,format=webp/crash_game_stats.png 1440w"
            sizes="80vw">
    
    
    <source media="(min-width: 1025px)" 
            srcset="https://static.philippdubach.com/cdn-cgi/image/width=1200,quality=80,format=webp/crash_game_stats.png 1200w,
                    https://static.philippdubach.com/cdn-cgi/image/width=1600,quality=80,format=webp/crash_game_stats.png 1600w,
                    https://static.philippdubach.com/cdn-cgi/image/width=2000,quality=80,format=webp/crash_game_stats.png 2000w"
            sizes="80vw">
    
    
    <img src="https://static.philippdubach.com/cdn-cgi/image/width=1200,quality=80/crash_game_stats.png" 
         alt="Script recording 20000 rounds over six days (112 hours total)" 
         class=""
         width="1200"
         height="630"
         loading="lazy"
         decoding="async"
         style="width: 100%; height: auto; display: block;">
  </picture>
</a>


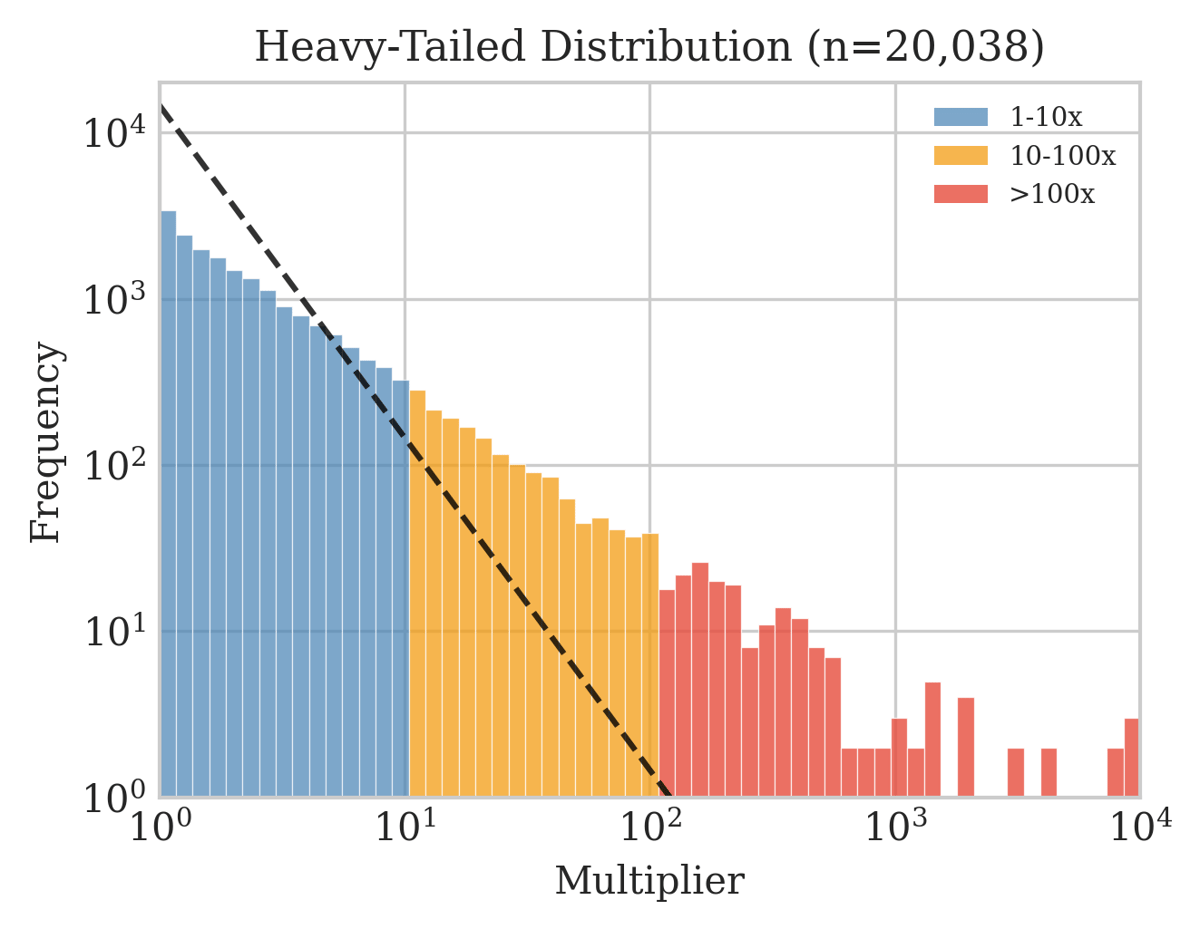
The distribution below shows the classic heavy tail: most rounds crash quickly at low multipliers, while rare events produce 100x or even 1000x payouts. The maximum I observed was 10,000x. This extreme variance creates the illusion of big wins just around the corner while the house edge operates relentlessly over time.<a href="#lightbox-fig_distribution2-png-2" style="display: block; width: 80%; margin: 0 auto; padding: 1.5rem 0; text-decoration: none;">
  <picture class="img-lightbox">
    
    <source media="(max-width: 768px)" 
            srcset="https://static.philippdubach.com/cdn-cgi/image/width=320,quality=80,format=webp/fig_distribution2.png 320w,
                    https://static.philippdubach.com/cdn-cgi/image/width=480,quality=80,format=webp/fig_distribution2.png 480w,
                    https://static.philippdubach.com/cdn-cgi/image/width=640,quality=80,format=webp/fig_distribution2.png 640w,
                    https://static.philippdubach.com/cdn-cgi/image/width=960,quality=80,format=webp/fig_distribution2.png 960w,
                    https://static.philippdubach.com/cdn-cgi/image/width=1200,quality=80,format=webp/fig_distribution2.png 1200w"
            sizes="80vw">
    
    
    <source media="(max-width: 1024px)" 
            srcset="https://static.philippdubach.com/cdn-cgi/image/width=768,quality=80,format=webp/fig_distribution2.png 768w,
                    https://static.philippdubach.com/cdn-cgi/image/width=1024,quality=80,format=webp/fig_distribution2.png 1024w,
                    https://static.philippdubach.com/cdn-cgi/image/width=1440,quality=80,format=webp/fig_distribution2.png 1440w"
            sizes="80vw">
    
    
    <source media="(min-width: 1025px)" 
            srcset="https://static.philippdubach.com/cdn-cgi/image/width=1200,quality=80,format=webp/fig_distribution2.png 1200w,
                    https://static.philippdubach.com/cdn-cgi/image/width=1600,quality=80,format=webp/fig_distribution2.png 1600w,
                    https://static.philippdubach.com/cdn-cgi/image/width=2000,quality=80,format=webp/fig_distribution2.png 2000w"
            sizes="80vw">
    
    
    <img src="https://static.philippdubach.com/cdn-cgi/image/width=1200,quality=80/fig_distribution2.png" 
         alt="Heavy-tailed distribution of crash multipliers on log-log scale showing most rounds end at low multipliers while rare events exceed 100x or 1000x, with maximum observed at 10,000x" 
         class=""
         width="1200"
         height="630"
         loading="lazy"
         decoding="async"
         style="width: 100%; height: auto; display: block;">
  </picture>
</a>


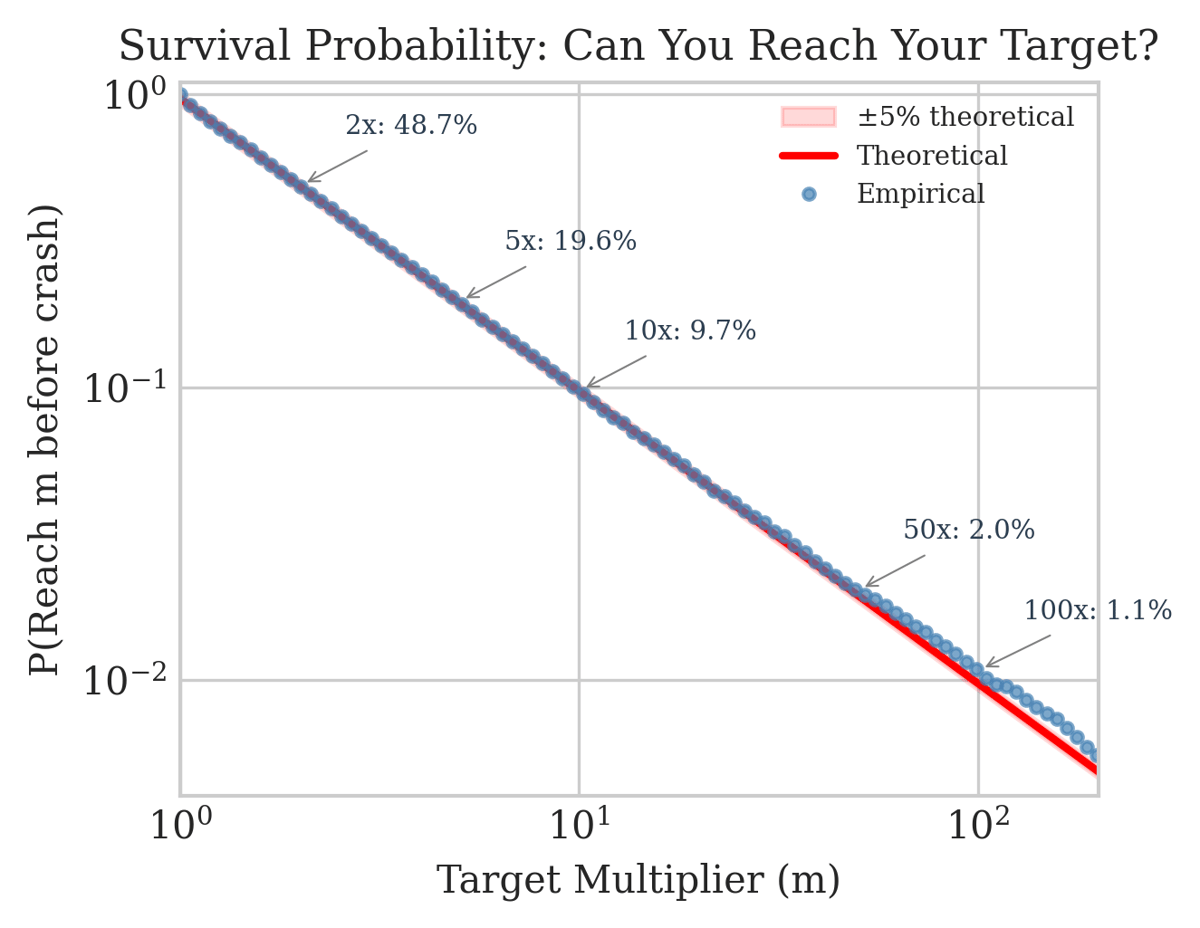
For a crash game with RTP = r (where 0 < r < 1), the crash multiplier M follows a specific probability distribution. The survival function is particularly relevant:

$$P(M \geq m) = \frac{r}{m}$$

This means the probability of reaching at least multiplier m before crashing equals r/m. For any cash-out target, the expected value of a unit bet works out to:

$$E[\text{Profit}] = P(M \geq m) \times m - 1 = \frac{r}{m} \times m - 1 = r - 1 = -0.03$$


This mathematical property makes crash games theoretically "strategy-proof" in expectation. No cash-out timing strategy should yield better long-term results than another.<a href="#lightbox-fig_survival_annotated-png-4" style="display: block; width: 80%; margin: 0 auto; padding: 1.5rem 0; text-decoration: none;">
  <picture class="img-lightbox">
    
    <source media="(max-width: 768px)" 
            srcset="https://static.philippdubach.com/cdn-cgi/image/width=320,quality=80,format=webp/fig_survival_annotated.png 320w,
                    https://static.philippdubach.com/cdn-cgi/image/width=480,quality=80,format=webp/fig_survival_annotated.png 480w,
                    https://static.philippdubach.com/cdn-cgi/image/width=640,quality=80,format=webp/fig_survival_annotated.png 640w,
                    https://static.philippdubach.com/cdn-cgi/image/width=960,quality=80,format=webp/fig_survival_annotated.png 960w,
                    https://static.philippdubach.com/cdn-cgi/image/width=1200,quality=80,format=webp/fig_survival_annotated.png 1200w"
            sizes="80vw">
    
    
    <source media="(max-width: 1024px)" 
            srcset="https://static.philippdubach.com/cdn-cgi/image/width=768,quality=80,format=webp/fig_survival_annotated.png 768w,
                    https://static.philippdubach.com/cdn-cgi/image/width=1024,quality=80,format=webp/fig_survival_annotated.png 1024w,
                    https://static.philippdubach.com/cdn-cgi/image/width=1440,quality=80,format=webp/fig_survival_annotated.png 1440w"
            sizes="80vw">
    
    
    <source media="(min-width: 1025px)" 
            srcset="https://static.philippdubach.com/cdn-cgi/image/width=1200,quality=80,format=webp/fig_survival_annotated.png 1200w,
                    https://static.philippdubach.com/cdn-cgi/image/width=1600,quality=80,format=webp/fig_survival_annotated.png 1600w,
                    https://static.philippdubach.com/cdn-cgi/image/width=2000,quality=80,format=webp/fig_survival_annotated.png 2000w"
            sizes="80vw">
    
    
    <img src="https://static.philippdubach.com/cdn-cgi/image/width=1200,quality=80/fig_survival_annotated.png" 
         alt="Survival probability curve on log-log scale showing probability of reaching target multiplier: 2x succeeds 48.5% of the time, 5x at 19.6%, 10x at 9.7%, 50x at 2.0%, and 100x at just 1.1%" 
         class=""
         width="1200"
         height="630"
         loading="lazy"
         decoding="async"
         style="width: 100%; height: auto; display: block;">
  </picture>
</a>


The empirical data matches theory almost perfectly. A 2x target succeeds about 48.5% of the time. Aiming for 10x? That works only 9.7% of rounds. The close fit between my observations and the theoretical line confirms the stated 97% RTP.

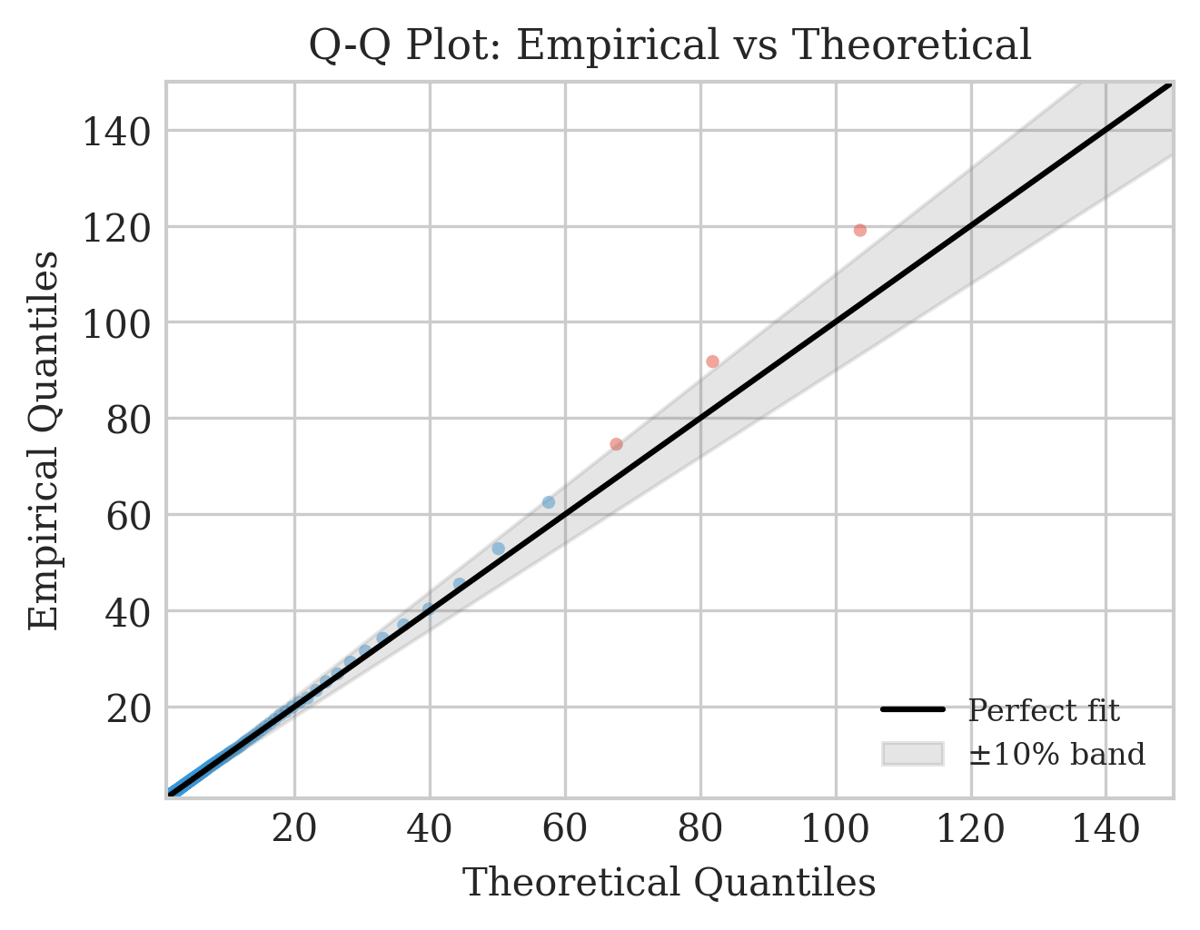
So is the game fair? My analysis says yes. Using three different statistical methods (log-log regression, maximum likelihood, and the Hill estimator), I estimated the probability density function exponent at α ≈ 1.98, within 2.2% of the theoretical value of 2.0. This contrasts with [Wang and Pleimling's 2019 research](https://www.nature.com/articles/s41598-019-50168-2) that found exponents of 1.4 to 1.9 for player cashout distributions. The key distinction: their deviations reflect player behavioral biases (probability weighting), not game manipulation. The random number generator produces fair outcomes.<a href="#lightbox-fig_qq_enhanced-png-5" style="display: block; width: 80%; margin: 0 auto; padding: 1.5rem 0; text-decoration: none;">
  <picture class="img-lightbox">
    
    <source media="(max-width: 768px)" 
            srcset="https://static.philippdubach.com/cdn-cgi/image/width=320,quality=80,format=webp/fig_qq_enhanced.png 320w,
                    https://static.philippdubach.com/cdn-cgi/image/width=480,quality=80,format=webp/fig_qq_enhanced.png 480w,
                    https://static.philippdubach.com/cdn-cgi/image/width=640,quality=80,format=webp/fig_qq_enhanced.png 640w,
                    https://static.philippdubach.com/cdn-cgi/image/width=960,quality=80,format=webp/fig_qq_enhanced.png 960w,
                    https://static.philippdubach.com/cdn-cgi/image/width=1200,quality=80,format=webp/fig_qq_enhanced.png 1200w"
            sizes="80vw">
    
    
    <source media="(max-width: 1024px)" 
            srcset="https://static.philippdubach.com/cdn-cgi/image/width=768,quality=80,format=webp/fig_qq_enhanced.png 768w,
                    https://static.philippdubach.com/cdn-cgi/image/width=1024,quality=80,format=webp/fig_qq_enhanced.png 1024w,
                    https://static.philippdubach.com/cdn-cgi/image/width=1440,quality=80,format=webp/fig_qq_enhanced.png 1440w"
            sizes="80vw">
    
    
    <source media="(min-width: 1025px)" 
            srcset="https://static.philippdubach.com/cdn-cgi/image/width=1200,quality=80,format=webp/fig_qq_enhanced.png 1200w,
                    https://static.philippdubach.com/cdn-cgi/image/width=1600,quality=80,format=webp/fig_qq_enhanced.png 1600w,
                    https://static.philippdubach.com/cdn-cgi/image/width=2000,quality=80,format=webp/fig_qq_enhanced.png 2000w"
            sizes="80vw">
    
    
    <img src="https://static.philippdubach.com/cdn-cgi/image/width=1200,quality=80/fig_qq_enhanced.png" 
         alt="Q-Q plot comparing empirical vs theoretical quantiles with perfect fit line and 10% confidence band, showing close alignment confirming fair random number generation" 
         class=""
         width="1200"
         height="630"
         loading="lazy"
         decoding="async"
         style="width: 100%; height: auto; display: block;">
  </picture>
</a>


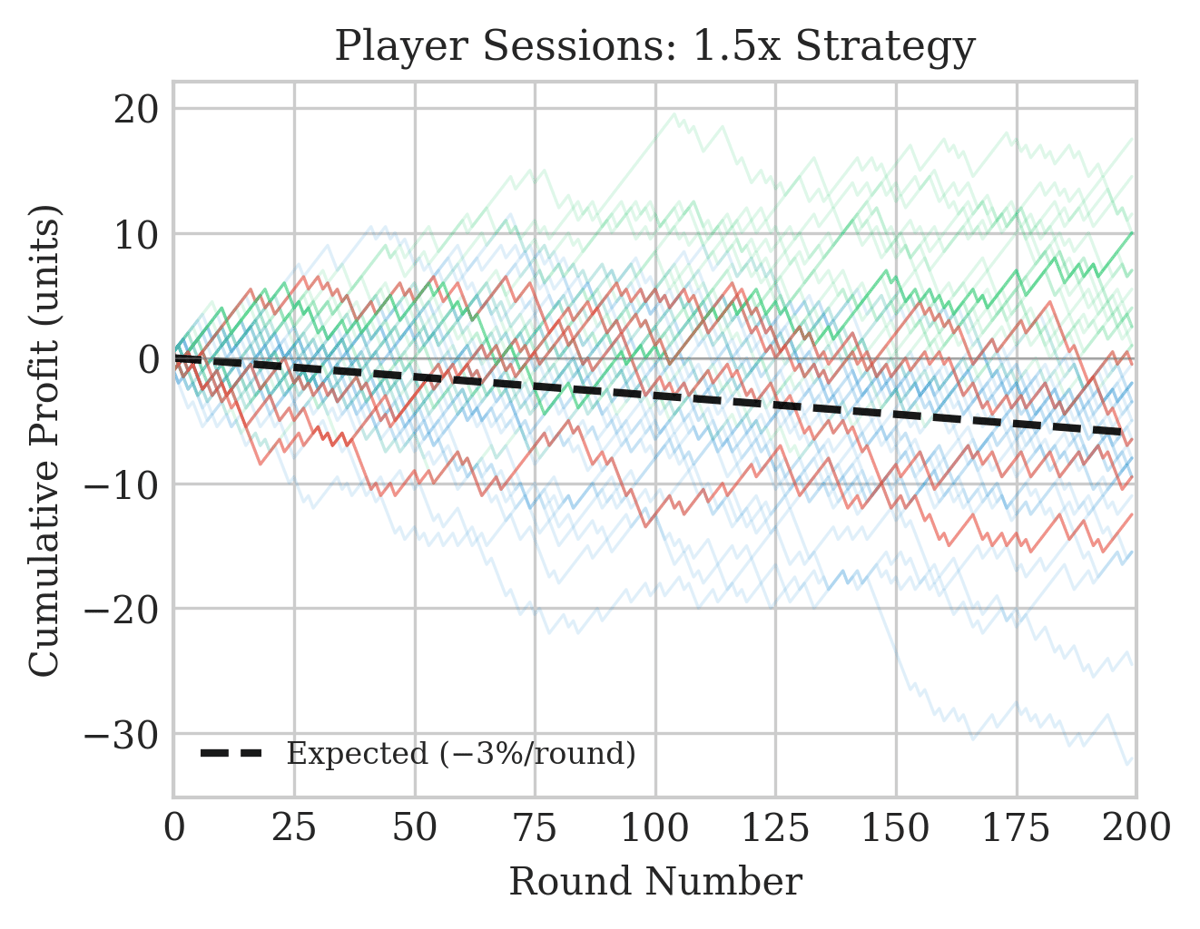
I then ran Monte Carlo simulations of 10,000 betting sessions under four different strategies: conservative 1.5x cashouts, moderate 2.0x, aggressive 3.0x, and high-risk 5.0x targets.<a href="#lightbox-fig_strategies-png-6" style="display: block; width: 80%; margin: 0 auto; padding: 1.5rem 0; text-decoration: none;">
  <picture class="img-lightbox">
    
    <source media="(max-width: 768px)" 
            srcset="https://static.philippdubach.com/cdn-cgi/image/width=320,quality=80,format=webp/fig_strategies.png 320w,
                    https://static.philippdubach.com/cdn-cgi/image/width=480,quality=80,format=webp/fig_strategies.png 480w,
                    https://static.philippdubach.com/cdn-cgi/image/width=640,quality=80,format=webp/fig_strategies.png 640w,
                    https://static.philippdubach.com/cdn-cgi/image/width=960,quality=80,format=webp/fig_strategies.png 960w,
                    https://static.philippdubach.com/cdn-cgi/image/width=1200,quality=80,format=webp/fig_strategies.png 1200w"
            sizes="80vw">
    
    
    <source media="(max-width: 1024px)" 
            srcset="https://static.philippdubach.com/cdn-cgi/image/width=768,quality=80,format=webp/fig_strategies.png 768w,
                    https://static.philippdubach.com/cdn-cgi/image/width=1024,quality=80,format=webp/fig_strategies.png 1024w,
                    https://static.philippdubach.com/cdn-cgi/image/width=1440,quality=80,format=webp/fig_strategies.png 1440w"
            sizes="80vw">
    
    
    <source media="(min-width: 1025px)" 
            srcset="https://static.philippdubach.com/cdn-cgi/image/width=1200,quality=80,format=webp/fig_strategies.png 1200w,
                    https://static.philippdubach.com/cdn-cgi/image/width=1600,quality=80,format=webp/fig_strategies.png 1600w,
                    https://static.philippdubach.com/cdn-cgi/image/width=2000,quality=80,format=webp/fig_strategies.png 2000w"
            sizes="80vw">
    
    
    <img src="https://static.philippdubach.com/cdn-cgi/image/width=1200,quality=80/fig_strategies.png" 
         alt="Strategy comparison boxplot showing session returns for 100 rounds: 1.5x Conservative averages -2.9%, 2.0x Moderate -2.4%, 3.0x Aggressive -3.3%, and 5.0x High Risk -3.5%, all negative" 
         class=""
         width="1200"
         height="630"
         loading="lazy"
         decoding="async"
         style="width: 100%; height: auto; display: block;">
  </picture>
</a>


Every single strategy produces negative expected returns. The conservative approach has lower variance but still loses. The aggressive strategies lose faster with higher variance.<a href="#lightbox-fig_trajectories-png-7" style="display: block; width: 80%; margin: 0 auto; padding: 1.5rem 0; text-decoration: none;">
  <picture class="img-lightbox">
    
    <source media="(max-width: 768px)" 
            srcset="https://static.philippdubach.com/cdn-cgi/image/width=320,quality=80,format=webp/fig_trajectories.png 320w,
                    https://static.philippdubach.com/cdn-cgi/image/width=480,quality=80,format=webp/fig_trajectories.png 480w,
                    https://static.philippdubach.com/cdn-cgi/image/width=640,quality=80,format=webp/fig_trajectories.png 640w,
                    https://static.philippdubach.com/cdn-cgi/image/width=960,quality=80,format=webp/fig_trajectories.png 960w,
                    https://static.philippdubach.com/cdn-cgi/image/width=1200,quality=80,format=webp/fig_trajectories.png 1200w"
            sizes="80vw">
    
    
    <source media="(max-width: 1024px)" 
            srcset="https://static.philippdubach.com/cdn-cgi/image/width=768,quality=80,format=webp/fig_trajectories.png 768w,
                    https://static.philippdubach.com/cdn-cgi/image/width=1024,quality=80,format=webp/fig_trajectories.png 1024w,
                    https://static.philippdubach.com/cdn-cgi/image/width=1440,quality=80,format=webp/fig_trajectories.png 1440w"
            sizes="80vw">
    
    
    <source media="(min-width: 1025px)" 
            srcset="https://static.philippdubach.com/cdn-cgi/image/width=1200,quality=80,format=webp/fig_trajectories.png 1200w,
                    https://static.philippdubach.com/cdn-cgi/image/width=1600,quality=80,format=webp/fig_trajectories.png 1600w,
                    https://static.philippdubach.com/cdn-cgi/image/width=2000,quality=80,format=webp/fig_trajectories.png 2000w"
            sizes="80vw">
    
    
    <img src="https://static.philippdubach.com/cdn-cgi/image/width=1200,quality=80/fig_trajectories.png" 
         alt="Simulated player sessions using 1.5x strategy over 200 rounds showing multiple trajectories trending toward expected loss line of -3% per round" 
         class=""
         width="1200"
         height="630"
         loading="lazy"
         decoding="async"
         style="width: 100%; height: auto; display: block;">
  </picture>
</a>


The consumer protection angle is what concerns me most. My data revealed 179 rounds per hour with 16-second median intervals. At that pace, with a 3% house edge per round, players face expected losses exceeding 500% of amounts wagered per hour of play. The manual cashout mechanic creates an illusion of control, masking the deterministic nature of losses.

The game is provably fair in the cryptographic sense. The mathematics check out. But mathematical fairness doesn't ensure consumer safety. The house always wins, and it wins fast.

>The only winning strategy is not to play

The full paper preprint with methodology and statistical details is [available on SSRN](https://papers.ssrn.com/sol3/papers.cfm?abstract_id=6065213). Code and data are on [GitHub](https://github.com/philippdubach/stats-gambling).


---

## Frequently Asked Questions

### Are provably fair crash games actually fair?

Yes, in the cryptographic sense. Statistical analysis of 20,000 rounds confirms the random number generator produces fair outcomes matching the stated 97% RTP. However, mathematical fairness doesn't ensure consumer safety, as the rapid pace of 179 rounds per hour means expected losses exceed 500% of amounts wagered per hour.

### Is there a winning strategy for crash games?

No. Monte Carlo simulations of 10,000 betting sessions across four strategies (1.5x, 2x, 3x, and 5x cash-outs) confirm every single strategy produces negative expected returns. The game is mathematically "strategy-proof" because the expected value equals RTP minus 1 regardless of cash-out timing.

### What are the odds of reaching a specific multiplier in crash games?

For a 97% RTP crash game, the probability of reaching multiplier m before crashing equals 0.97/m. A 2x target succeeds about 48.5% of the time. A 10x target works only 9.7% of rounds. A 100x target succeeds just 1.1% of the time.

### How much do players lose per hour in crash games?

At 179 rounds per hour with 16-second median intervals and a 3% house edge per round, players face expected losses exceeding 500% of amounts wagered per hour of play. This is far faster than traditional casino games.


---

*Philipp D. Dubach — [http://philippdubach.com/](http://philippdubach.com/) — 2026*