I’ve been reading the January 2026 state of markets reports from Andreessen Horowitz and AQR, and their conclusions are almost impossible to reconcile.
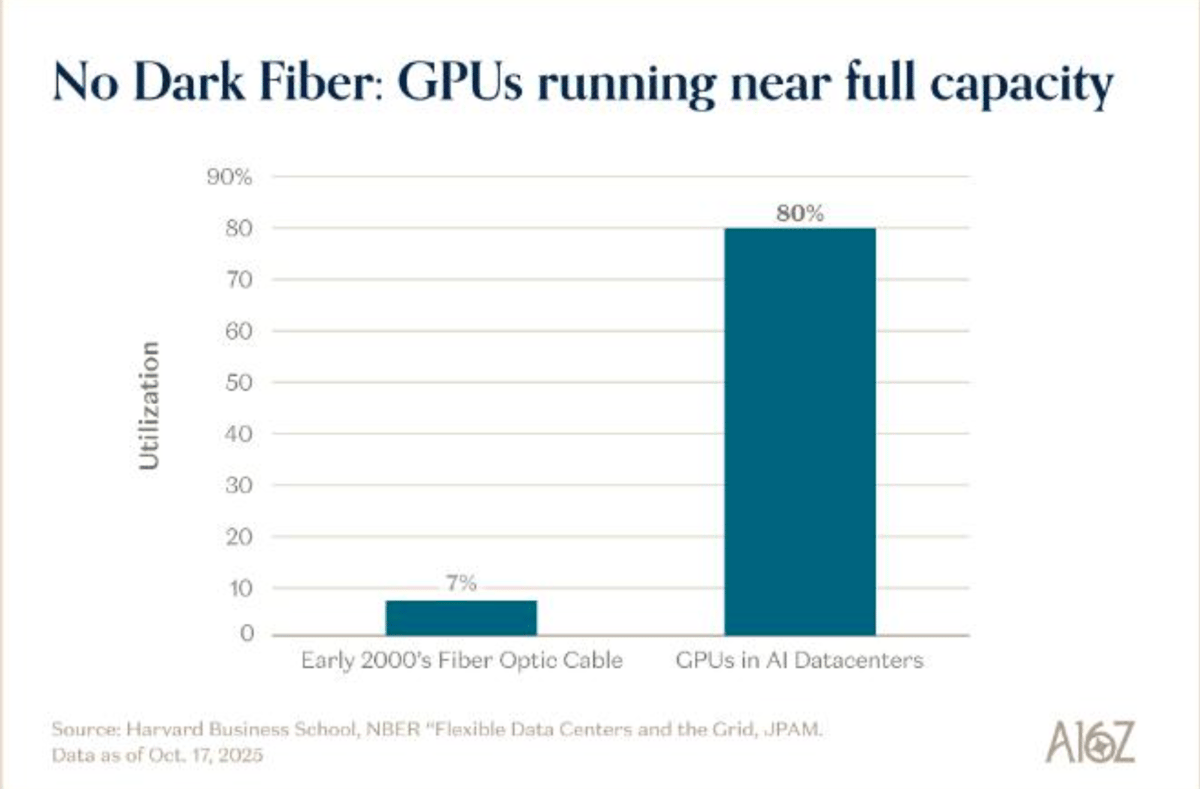
The a16z view is straightforward: AI fundamentals are real, and current prices reflect that reality. Their evidence is compelling. The top 50 private AI companies now generate $40.6 billion in annual revenue. Companies like ElevenLabs and Cursor are hitting $100 million ARR faster than Slack or Twilio ever did. GPUs are running at 80% utilization, compared to the 7% utilization rate for fiber optic cables during the dotcom bubble. This isn’t speculation, they argue. It’s demand exceeding supply.
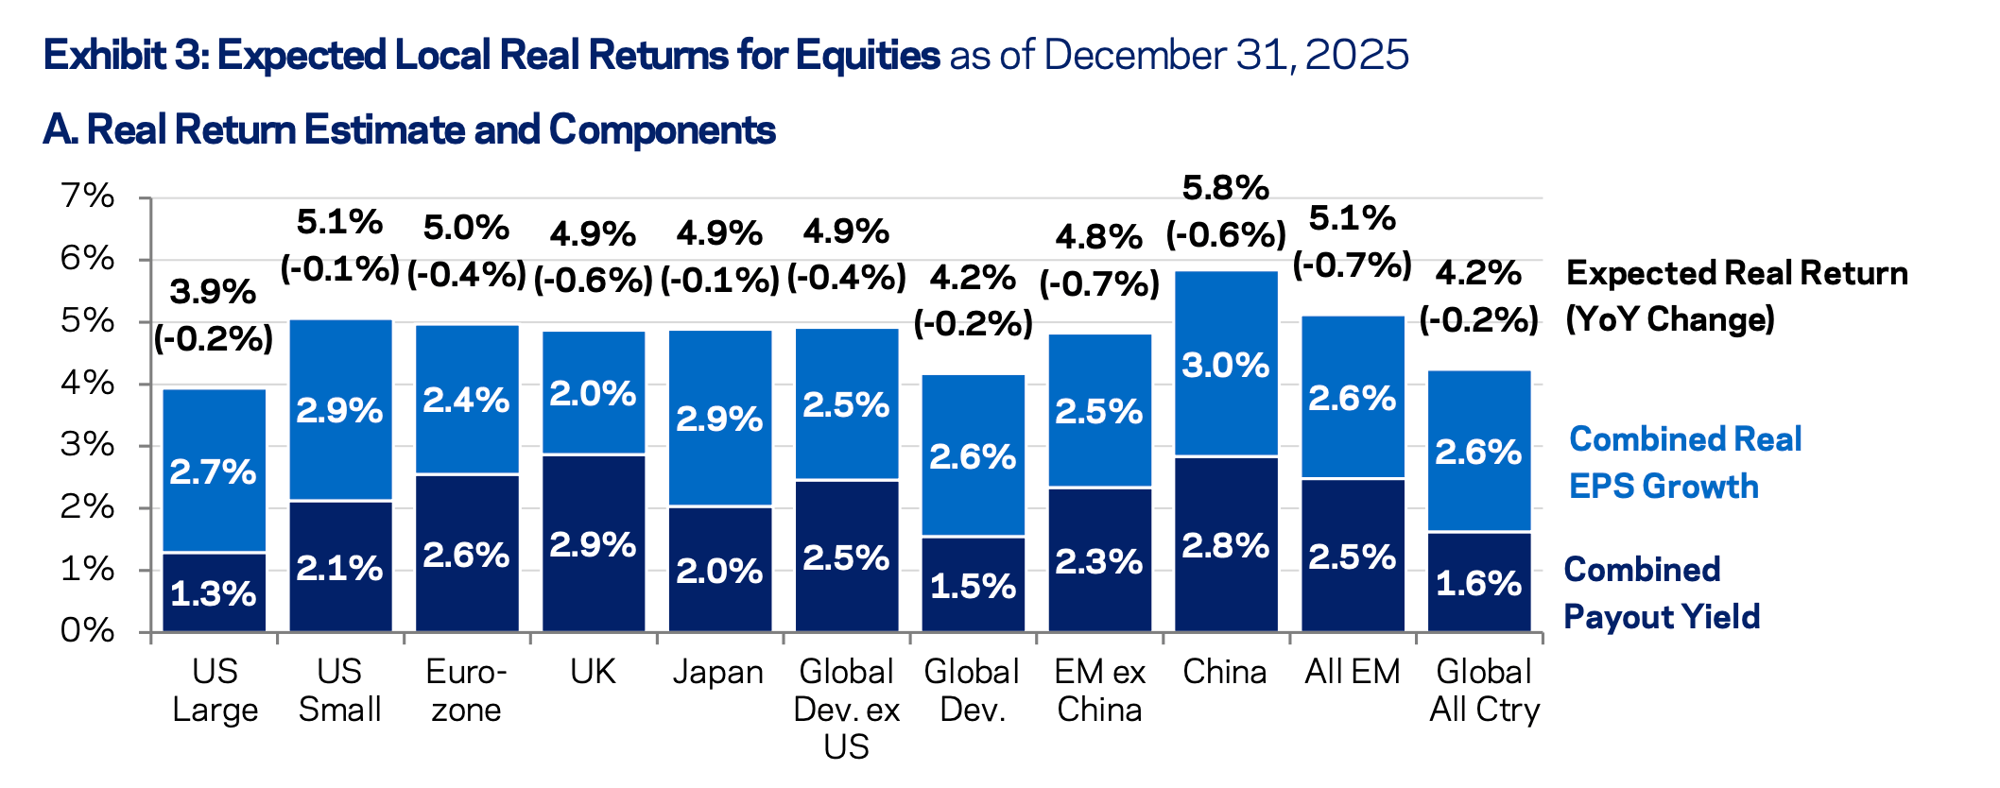
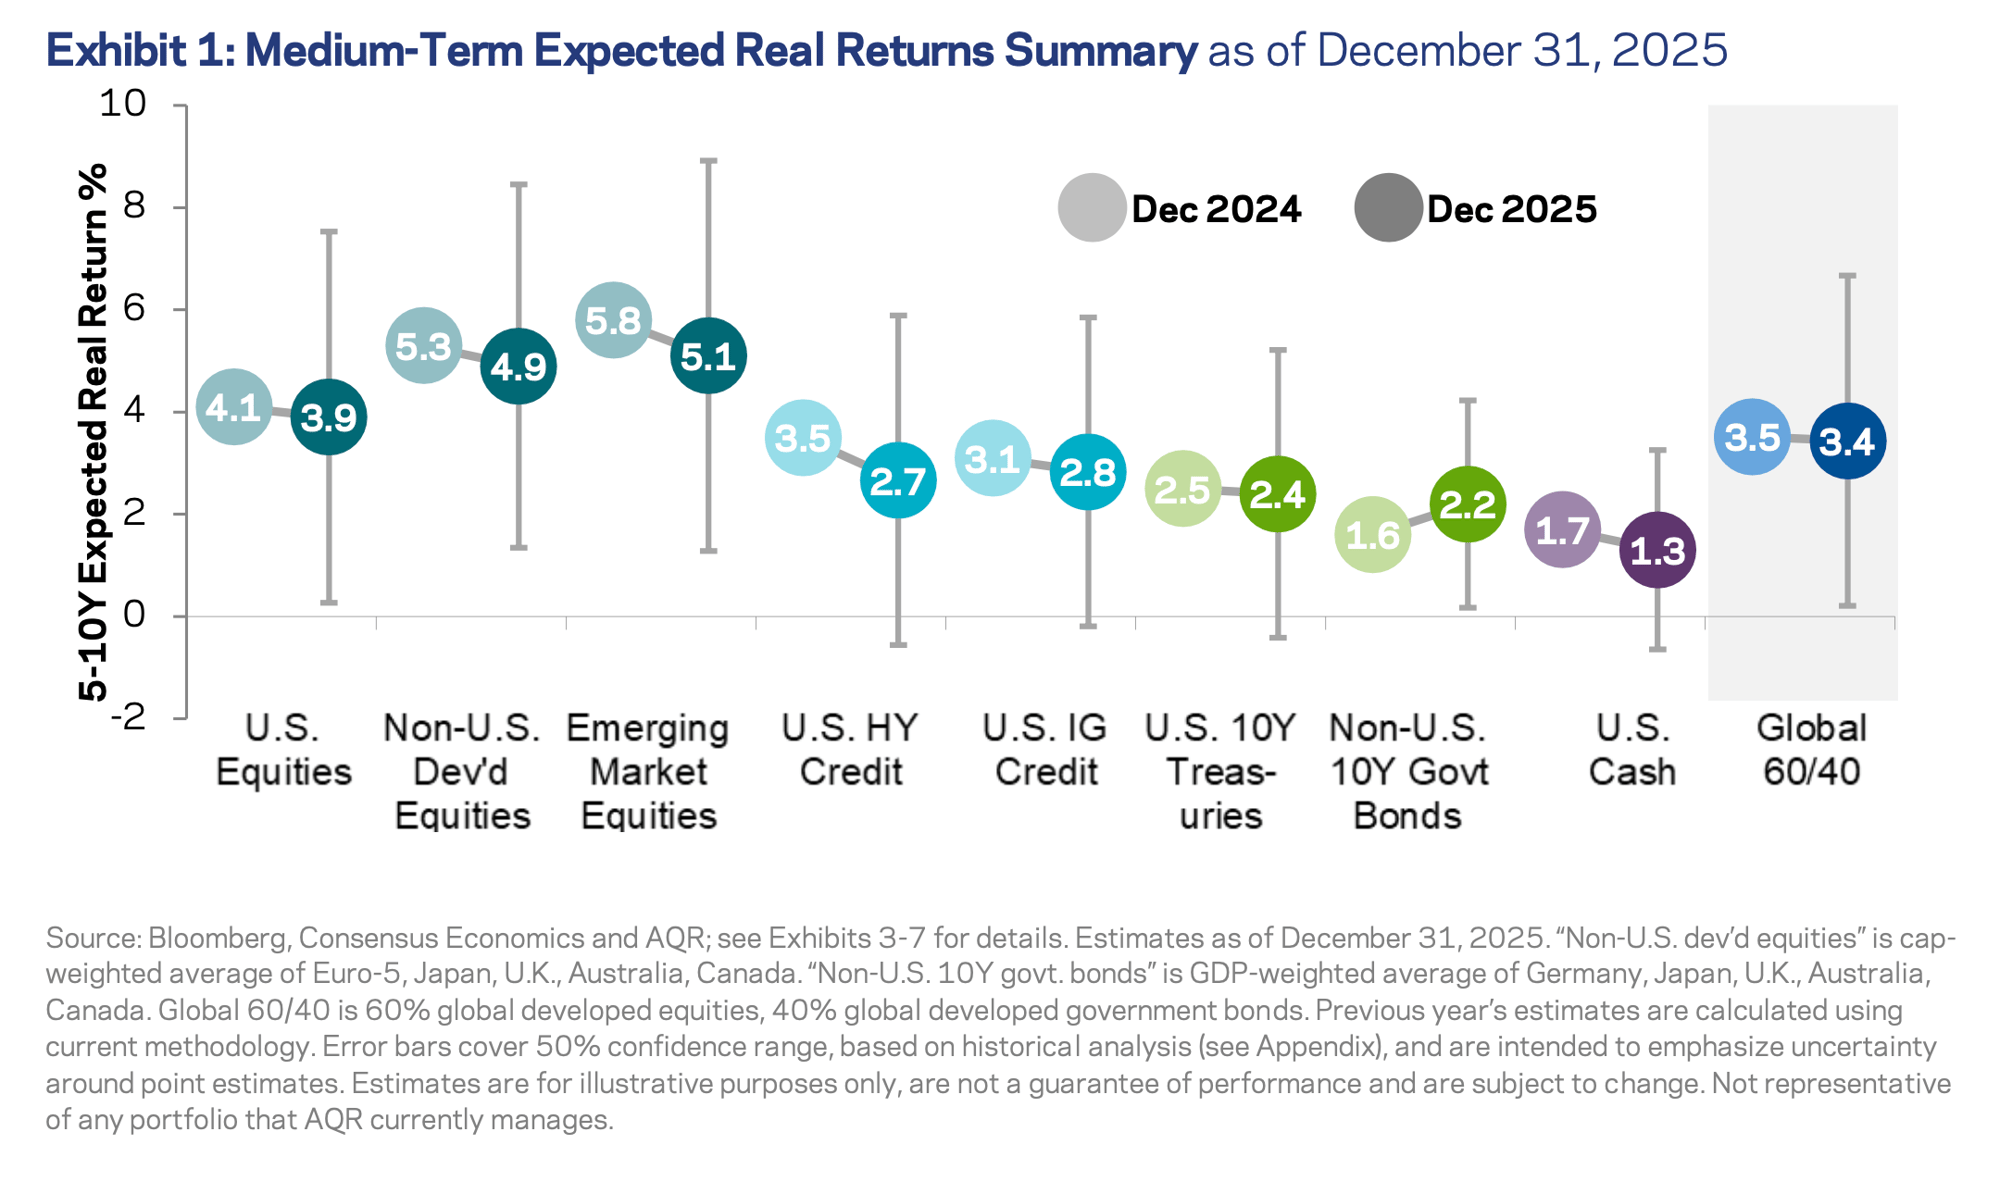
 AQR looks at the same market and sees something else entirely. Their capital market assumptions put the U.S. CAPE ratio at the 96th percentile since 1980. Expected real returns for U.S. large cap equities over the next 5-10 years? 3.9%. For a global 60/40 portfolio, just 3.4%, well below the long-term average of roughly 5% since 1900. Risk premia, in their framework, are compressed across nearly every asset class. The narrative doesn’t enter their models.

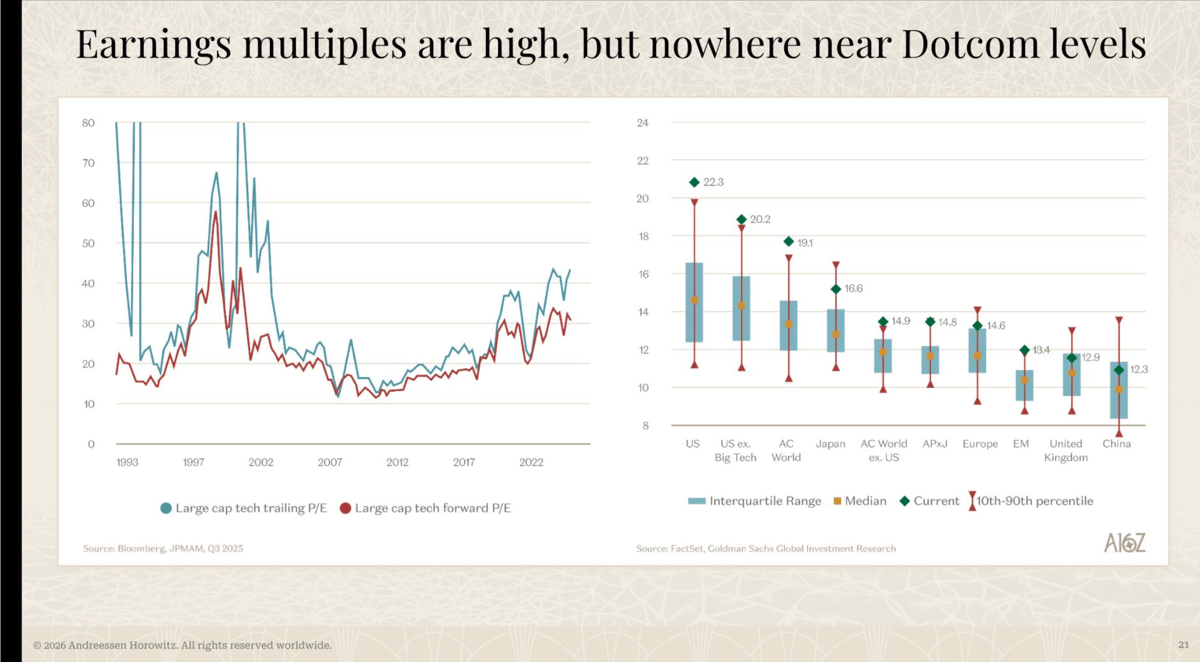
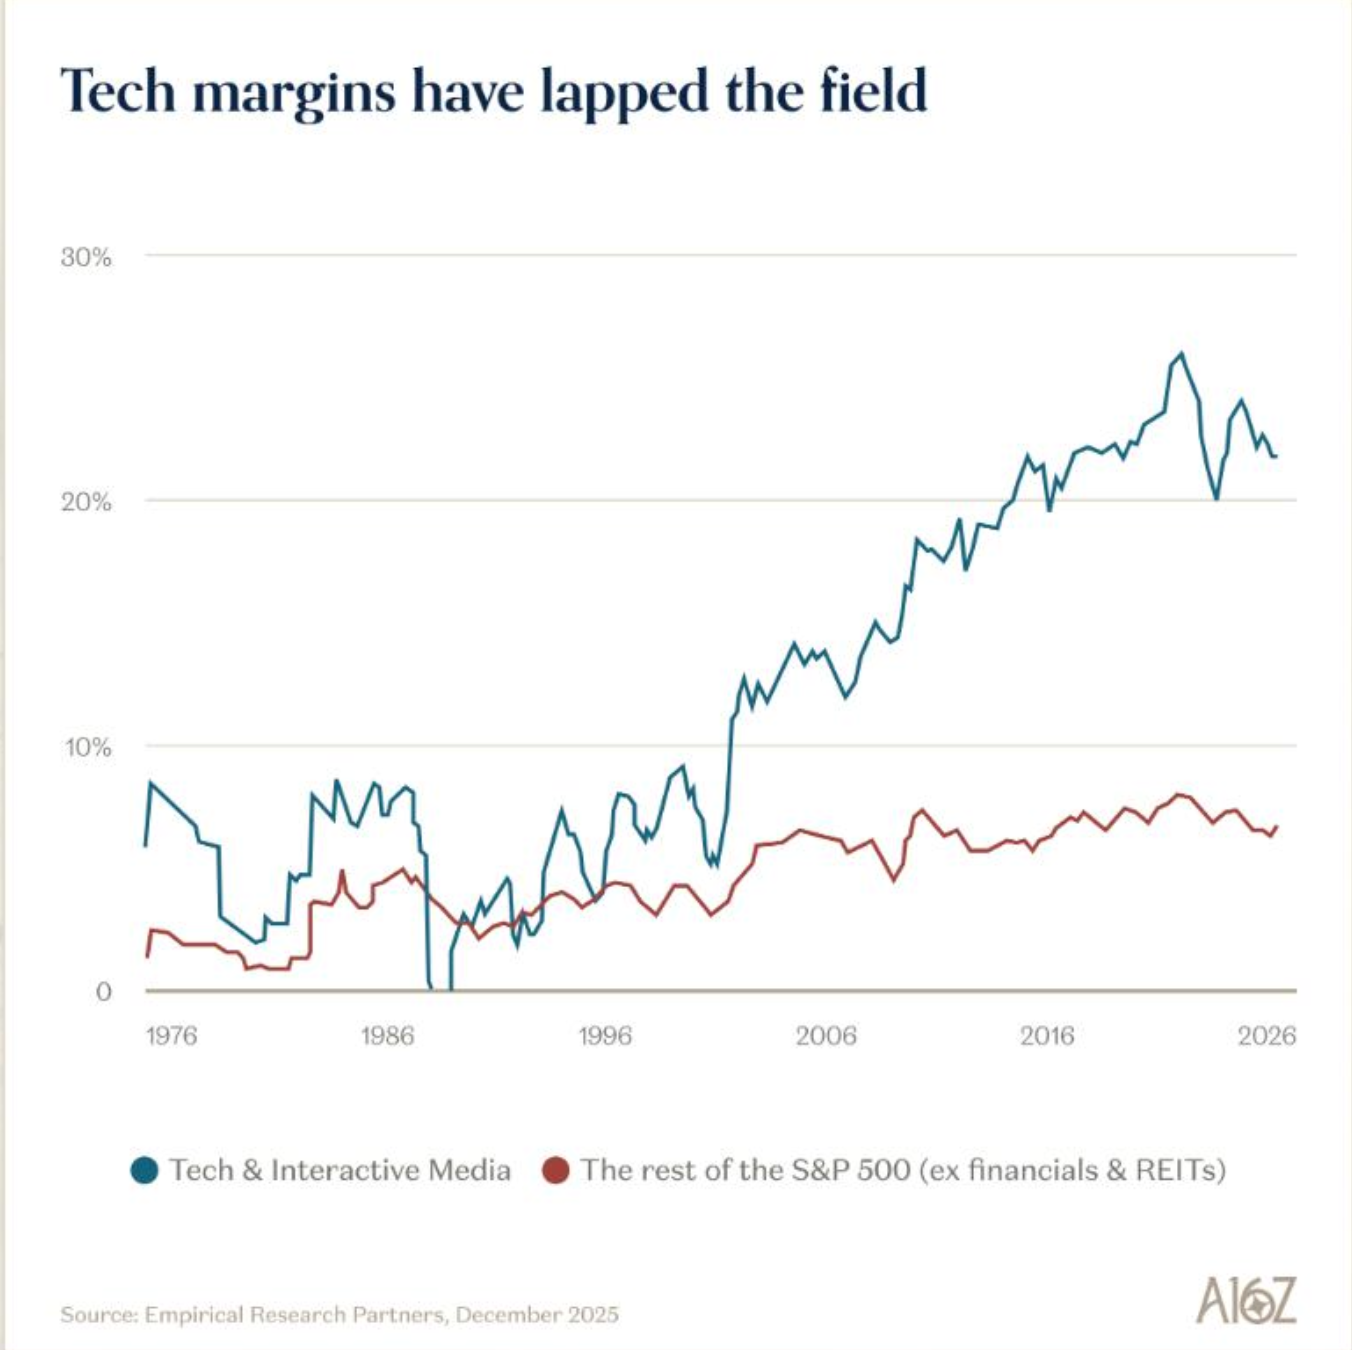
 a16z points to earnings growth. The market rally hasn’t been driven by multiple expansion, they note, but by actual EPS growth. Tech P/E multiples sit around 30-35x, elevated but nowhere near the 70-80x of 2000. Tech margins have “lapped the field” at 25%+ compared to 5-8% for the rest of the S&P 500. The fundamentals, they insist, are doing the work.


 AQR’s response would be that fundamentals always look good near peaks. Their research shows a 50% probability that realized equity returns will miss estimates by more than 3 percentage points annually over the next decade. Compressed premia don’t announce themselves with blaring headlines. They just quietly erode returns until investors notice they’ve been running in place.
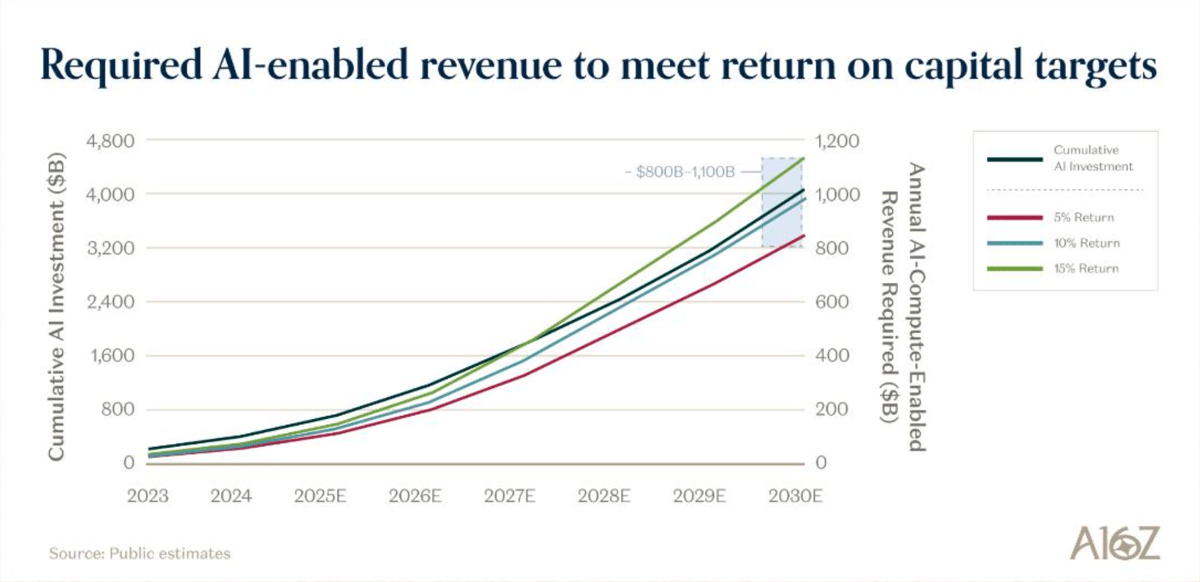
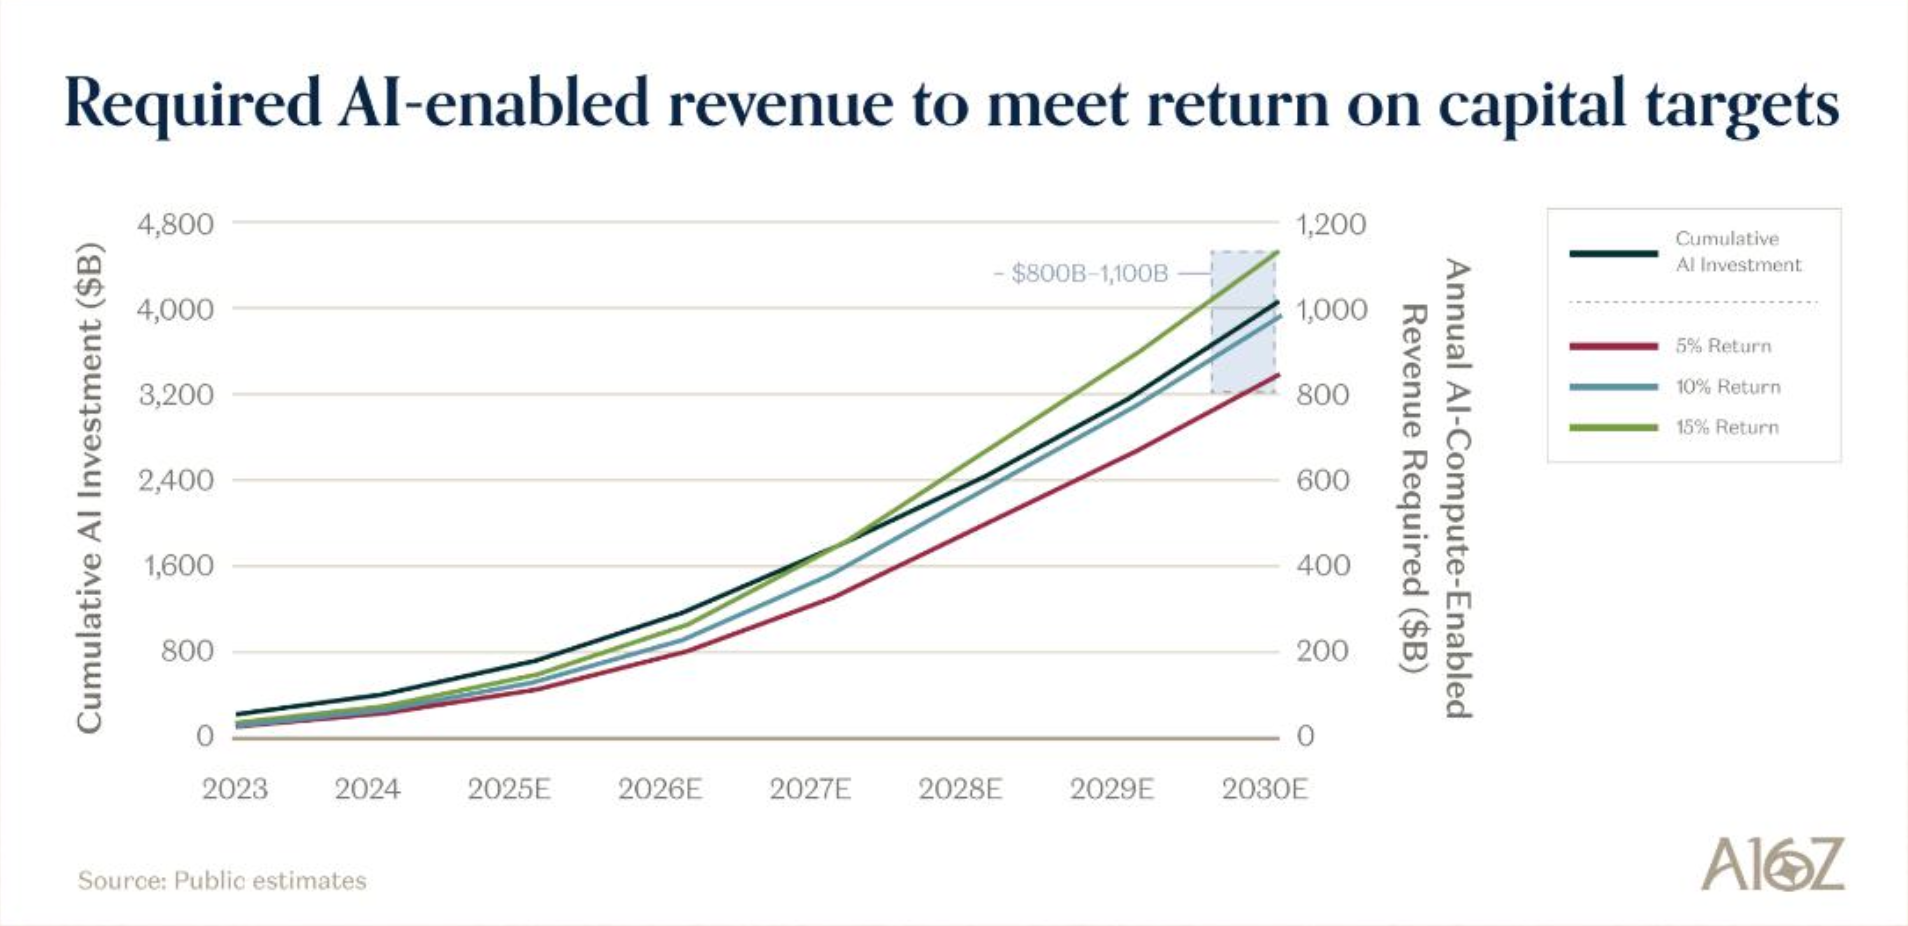
Cumulative hyperscaler capex is projected to reach $4.8 trillion by 2030. To achieve a 10% hurdle rate on that investment, AI revenue needs to hit roughly $1 trillion annually by 2030, about 1% of global GDP excluding China. Goldman Sachs estimates that $9 trillion in revenue could flow from the AI buildout, which at 20% margins and a 22x P/E multiple would create $35 trillion in new market cap. Only about $24 trillion has been pulled forward so far, leaving $11 trillion “on the table.“
 Or not. AQR would point out that the expected return for U.S. buyouts, private equity’s bread and butter, is now 4.2%. That’s barely above the 3.9% for public large caps. The illiquidity premium has essentially vanished. If sophisticated PE firms can’t find excess returns, why should AI capex be different?
I find myself uncertain, which feels like the more honest position. Neither source is disinterested. a16z manages billions in venture capital and growth equity; bullish AI narratives support their portfolio valuations and fundraising. AQR runs systematic strategies that benefit when investors diversify away from concentrated U.S. tech exposure toward international equities and alternatives. Both are talking their book, which doesn’t make either wrong, but it’s worth noting.
The a16z data on utilization and revenue growth is hard to dismiss. 80% GPU utilization isn’t vaporware. Harvey users nearly tripled their time on the platform in nine months. Navan’s AI handles half of all customer interactions at satisfaction levels matching human agents. These are real products generating real engagement. But AQR’s valuation work has a longer track record. Their models don’t care about narratives, and historically that discipline has been valuable. When they say U.S. equities offer the lowest expected returns among major markets, that’s not pessimism. It’s arithmetic.
The reconciliation might be this: AI winners could thrive spectacularly while broad market indices disappoint. a16z’s portfolio companies operate in a different universe than the average S&P 500 constituent. Compressed risk premia can coexist with individual companies generating enormous returns. The question is whether you’re buying the index or picking the winners.
Non-U.S. developed markets, by the way, offer expected returns of around 5%, versus 3.9% for U.S. large caps. The valuation gap is real even if the AI story is true.