
I spent the last week reading 12 bank AI research reports from nine of the world’s largest financial institutions: Goldman Sachs, JPMorgan, Morgan Stanley (three separate reports), UBS, Barclays, Bank of America, HSBC, Citi, Deutsche Bank, and Santander. I wanted to understand how institutions that collectively manage trillions of dollars and employ thousands of analysts actually see this technology heading into 2026: where they agree, where they diverge, and what they’re being less than forthcoming about.
What I found is useful, sometimes impressive, and (mostly) worth reading.
Concerning consensus
Every single institution frames AI as a general-purpose technology, not a product cycle. The analogies converge almost word-for-word: Goldman Sachs draws the line through railroads, electrification, and telecom. Santander deploys a formal three-stage GPT framework: steam, ICT, AI. Morgan Stanley’s semiconductor team writes that AI is “closer to electricity than consumer gadgets.” Deutsche Bank projects +$7 trillion in global GDP over the decade. UBS puts the AI revenue opportunity at $2.6 trillion by 2030.
Not one of the twelve reports seriously entertains the possibility that AI is more like 3D printing: genuinely useful in pockets, broadly disappointing in aggregate. Santander comes closest, citing Daron Acemoglu’s conservative +0.7% cumulative TFP estimate over ten years, but even Santander frames that as the floor of the range, not the central case. The optimistic end of the same distribution sits at +10–15%. That’s not a rounding error. It’s a fundamental disagreement about whether AI will re-run the productivity miracle of electrification or prove more modest in aggregate, and most banks quietly pick the point on the distribution that best supports their commercial positioning.
The chart below plots each bank by how bullish they are on AI’s economic impact against how grounded their analysis is in current empirical data versus forward projections. Bank of America sits alone in the top-right: data-driven and moderately bullish. Goldman sits at the bottom-right: maximally bullish, maximally projective. Santander is the lone occupant of the top-left: empirical and cautious.
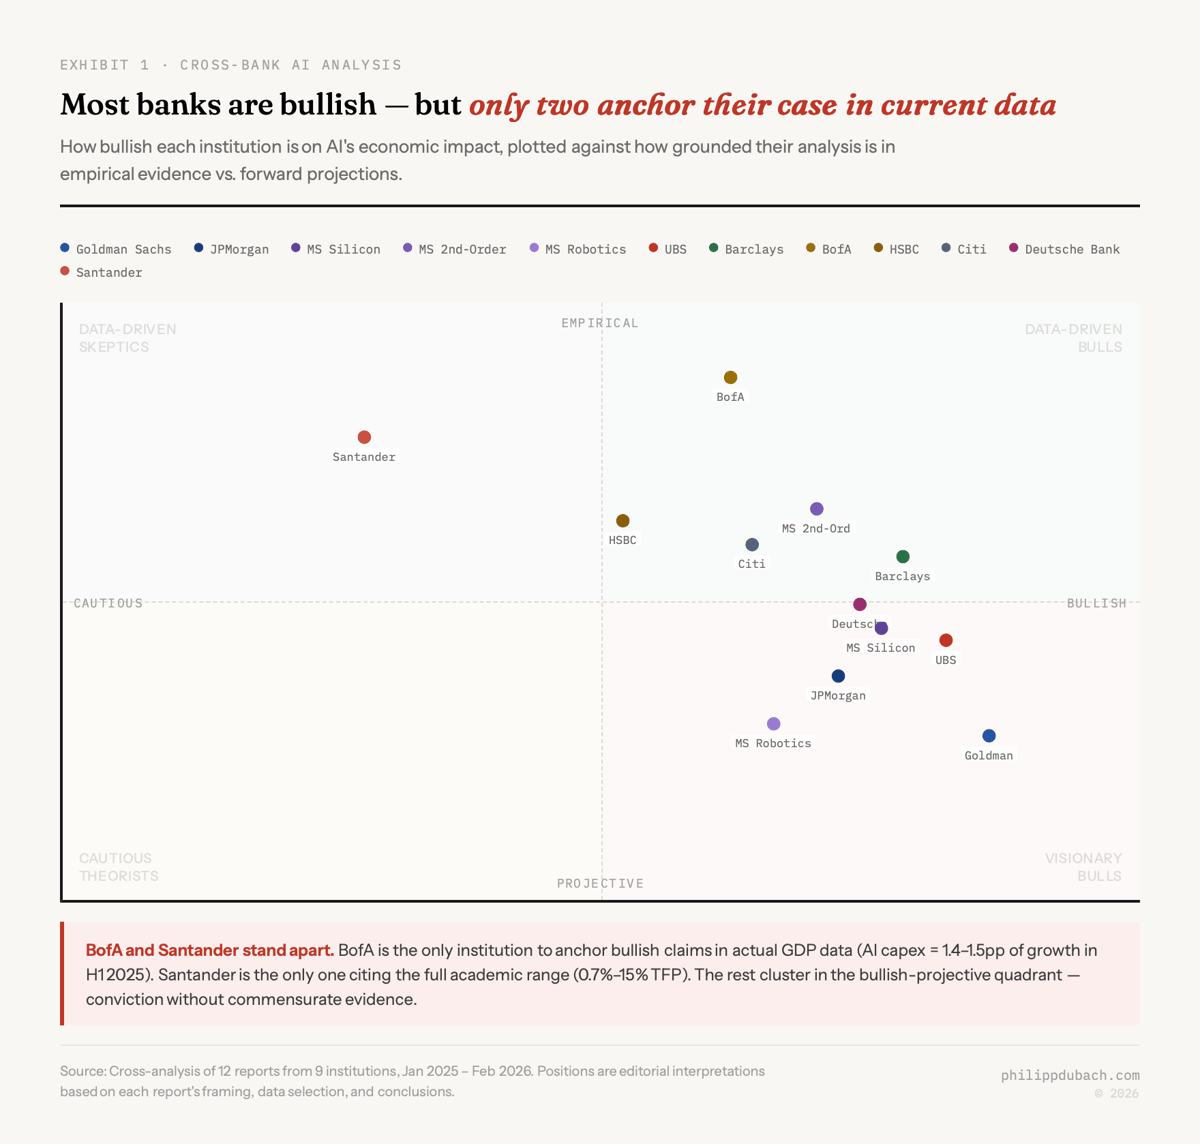

That chart is an editorial interpretation, not a precise measurement. But the shape is right. Bank of America is the only institution that consistently anchors its claims to actual GDP data rather than projections. Goldman Sachs, at the other extreme, produces a report that reads as a pitch to every infrastructure CFO and sovereign wealth fund in the world. Both can be making valid arguments. They’re just not making the same kind.
What’s happening vs. what might happen
BofA and Santander are the two worth pausing on, because they’re doing something different from the rest: they’re reporting what’s happening rather than what might happen.
Bank of America, using Bureau of Labor Statistics and Bureau of Economic Analysis data, finds that AI capex contributed 1.4–1.5 percentage points to US GDP growth in H1 2025. Headline growth rates were running around 2% in that period. So AI infrastructure spending was the single largest driver of US economic expansion. That’s a real number from real data, and it’s the most important figure in any of these reports.
BofA also finds a positive correlation between AI adoption and employment in white-collar sectors: software developers are up +17.9%, while insurance appraisers, a role where AI substitutes directly for human judgment, are down -20%. The disruption is concentrated in specific tasks. It hasn’t shown up in aggregate employment. Yet.
Then there’s Santander, which writes the most academically rigorous report of the twelve and includes numbers the consensus would rather not linger on. The enterprise AI adoption rate data is sobering: only around 10% of US companies are actually using AI to produce goods and services. 42% of companies abandoned GenAI projects in 2024, a figure corroborated by MIT’s 2025 GenAI Divide research, which found 95% of enterprise pilots fail to reach production. Only 1% of companies describe their rollouts as mature. Meanwhile, 78% say they use AI in at least one function. The gap between “we have a pilot” and “this is generating value” is enormous.
Goldman’s $800 million per day in hyperscaler capex and Santander’s 42% abandonment rate aren’t as contradictory as they look. Capex precedes productivity in every infrastructure cycle. That part is historically unambiguous. The question is how long the gap lasts, and whether the eventual productivity gains justify what’s been spent getting there.
Dotcom comparison
Every report that addresses the bubble question reaches the same conclusion: this isn’t the late 1990s.
The primary evidence is valuation. Nvidia trades at 25–30x forward earnings versus Cisco’s ~140x at the March 2000 peak. The Magnificent 6 sit at roughly 35x versus 55x for the TMT index at its apex. Morgan Stanley’s Silicon Backbone report makes this comparison rigorously, and I think they’re right that the earnings quality is categorically different from dot-com era technology stocks.
But the comparison works less cleanly when you look at concentration rather than individual valuations. Deutsche Bank notes that the top 10 S&P 500 companies now represent 40% of total market cap, an extreme not seen at the dot-com peak. A Bank of America fund manager survey from October 2025 found 54% of global managers believe AI equities are in a bubble, and 60% view global equities as overvalued. You can simultaneously hold that Nvidia’s PE is reasonable and that a portfolio with 40% weight in ten companies carries concentration risk that PE comparisons don’t capture. Reassuring on one axis. Alarming on another. Most sell-side AI research cites whichever data point supports its preferred conclusion and leaves the tension sitting there unaddressed.
There’s also a subtler version of the bubble question that none of the twelve reports asks directly. The “infrastructure comes before productivity” argument is historically correct: railroads were overbuilt before they transformed commerce; the internet fibre glut of 1999–2000 eventually became the backbone of the digital economy. But the investors who financed Global Crossing and 360networks still lost everything. The infrastructure thesis being correct in the long run isn’t the same as every current valuation being justified. Goldman’s report is particularly careful to avoid addressing that distinction. The implicit message, “we financed the pipes before and it worked out,” skips past the question of which financiers got paid and which got wiped out in the transition.
Sell side
The following chart maps risk awareness against bullishness of tone, and the clustering is revealing.
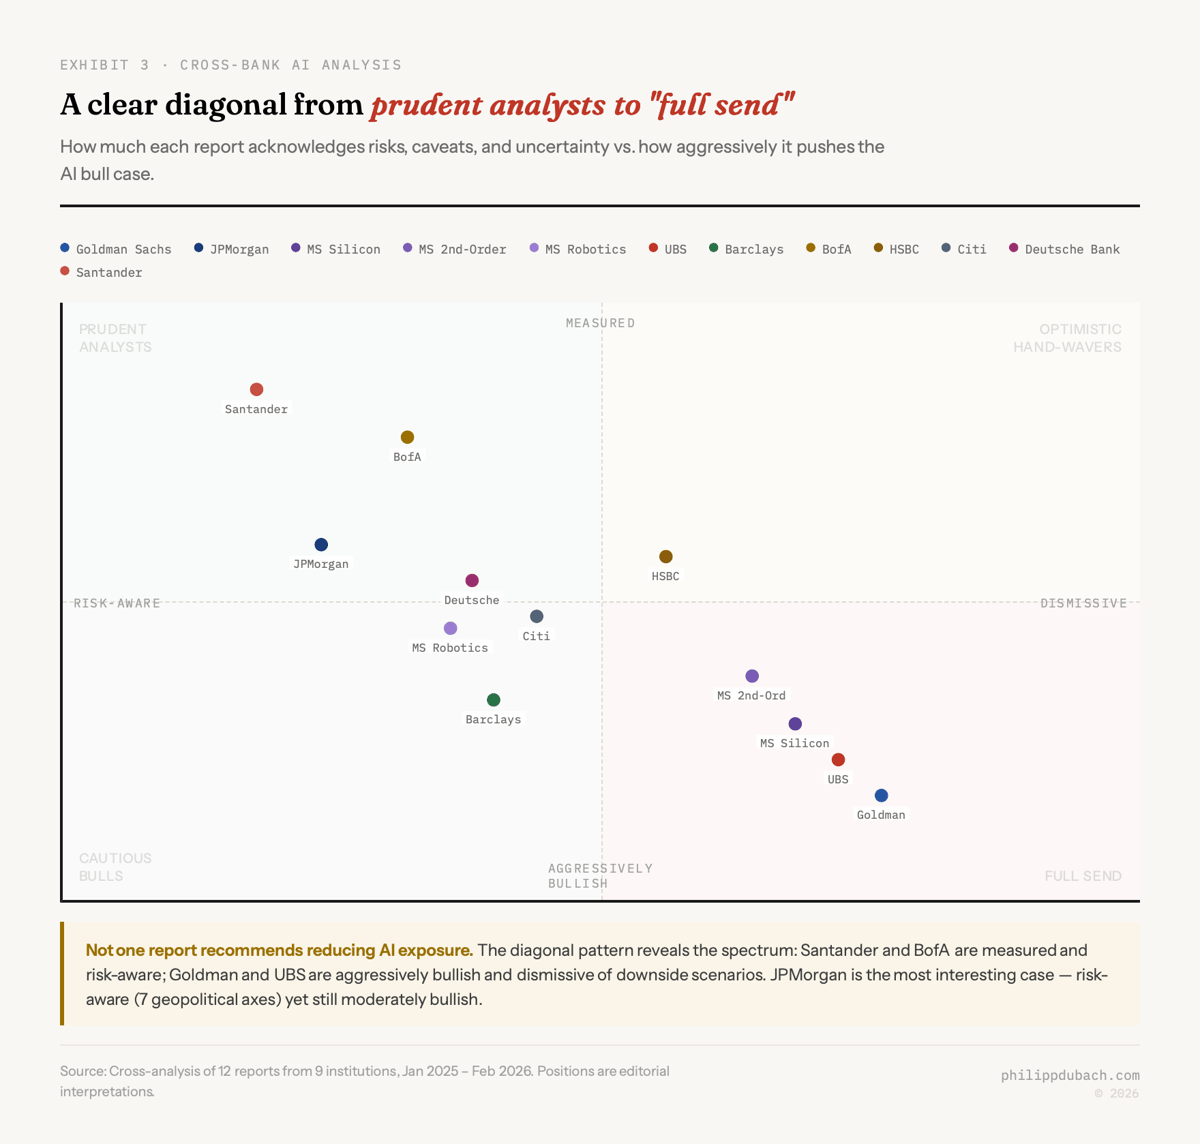

Goldman and UBS are in the bottom-right: aggressively bullish, risk-dismissive. Santander and BofA are in the top-left, actually wrestling with the uncertainty. HSBC is the clearest case of motivated reasoning: the report is written explicitly to stop private banking clients from panic-selling their SaaS positions after multiple quarters of multiple compression. (Whether that advice turns out to be right is a separate question.)
I don’t think this makes any of these reports dishonest. But the reader needs to supply the discount rate that each institution’s interests warrant.
Goldman Sachs earns advisory fees on the data centre and energy deals it describes. Barclays lends to energy infrastructure projects. Morgan Stanley is selling both EM equity exposure and second-order stock-picking strategies through its asset management arm. UBS provides a clean three-layer investment framework that maps directly to its wealth management product shelf. Citi frames AI as accelerating the electronification of markets, the very trend that drives Citi’s trading revenue. Deutsche Bank, most self-aware of the ten, used AI to generate its AI report. The meta-commentary is right there in the methodology.
Not a single report concludes “this may be overhyped and you should meaningfully reduce exposure.” Every institution has a commercial interest in the AI narrative staying bullish. That doesn’t mean the narrative is wrong. It does mean unanimous conviction from nine sell-side AI research teams is not the same thing as nine independent analyses reaching the same conclusion.
Second-order AI beneficiaries
The next two charts contain what I think is the most interesting tension across all twelve reports.
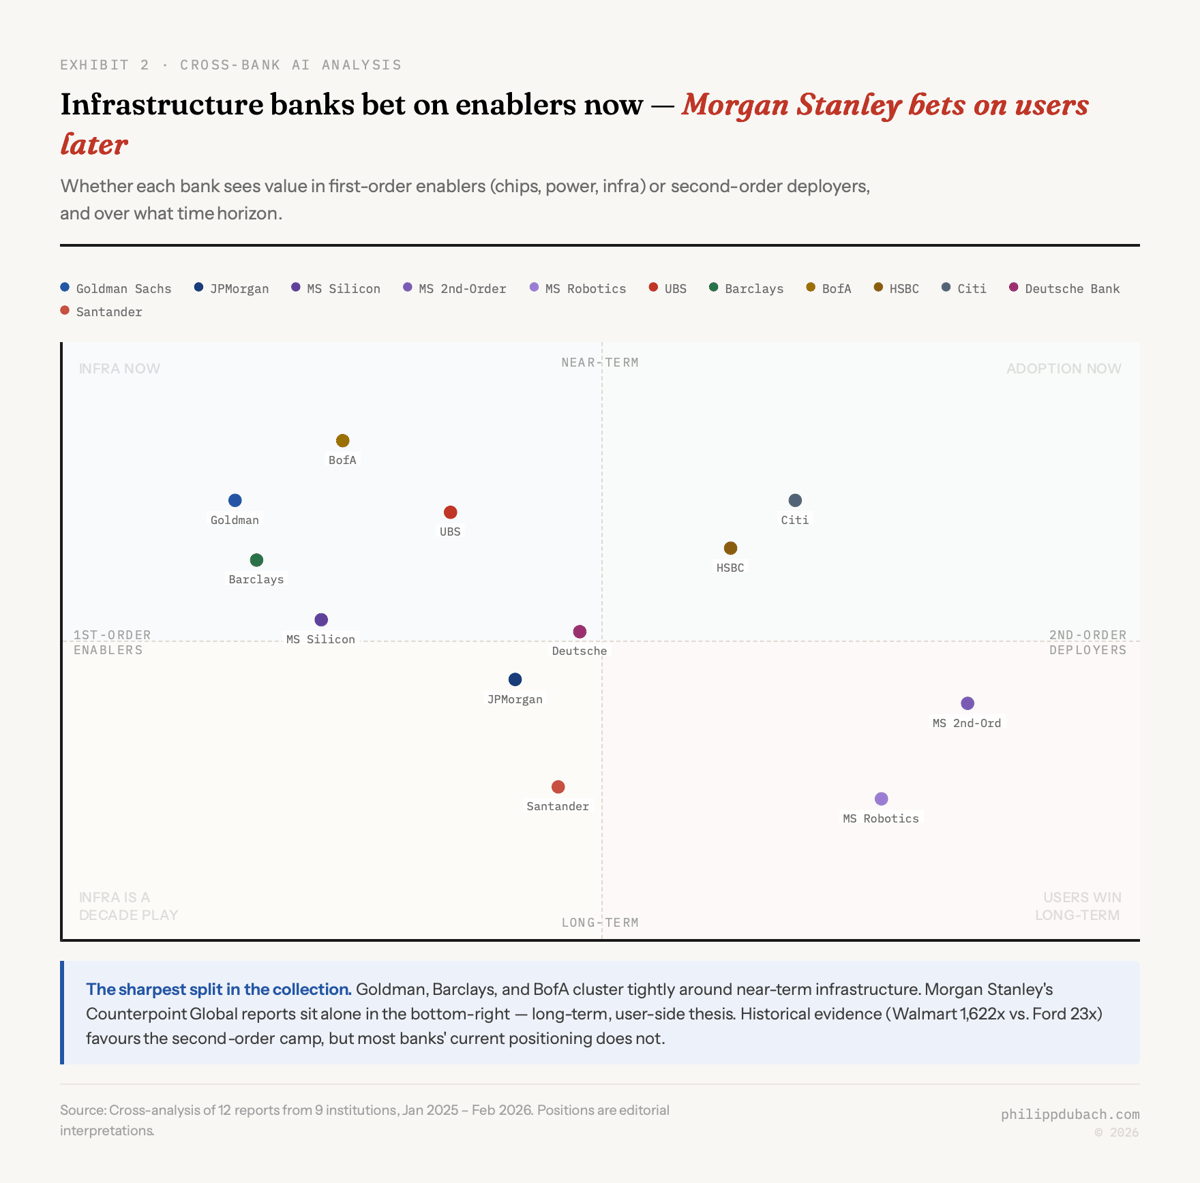
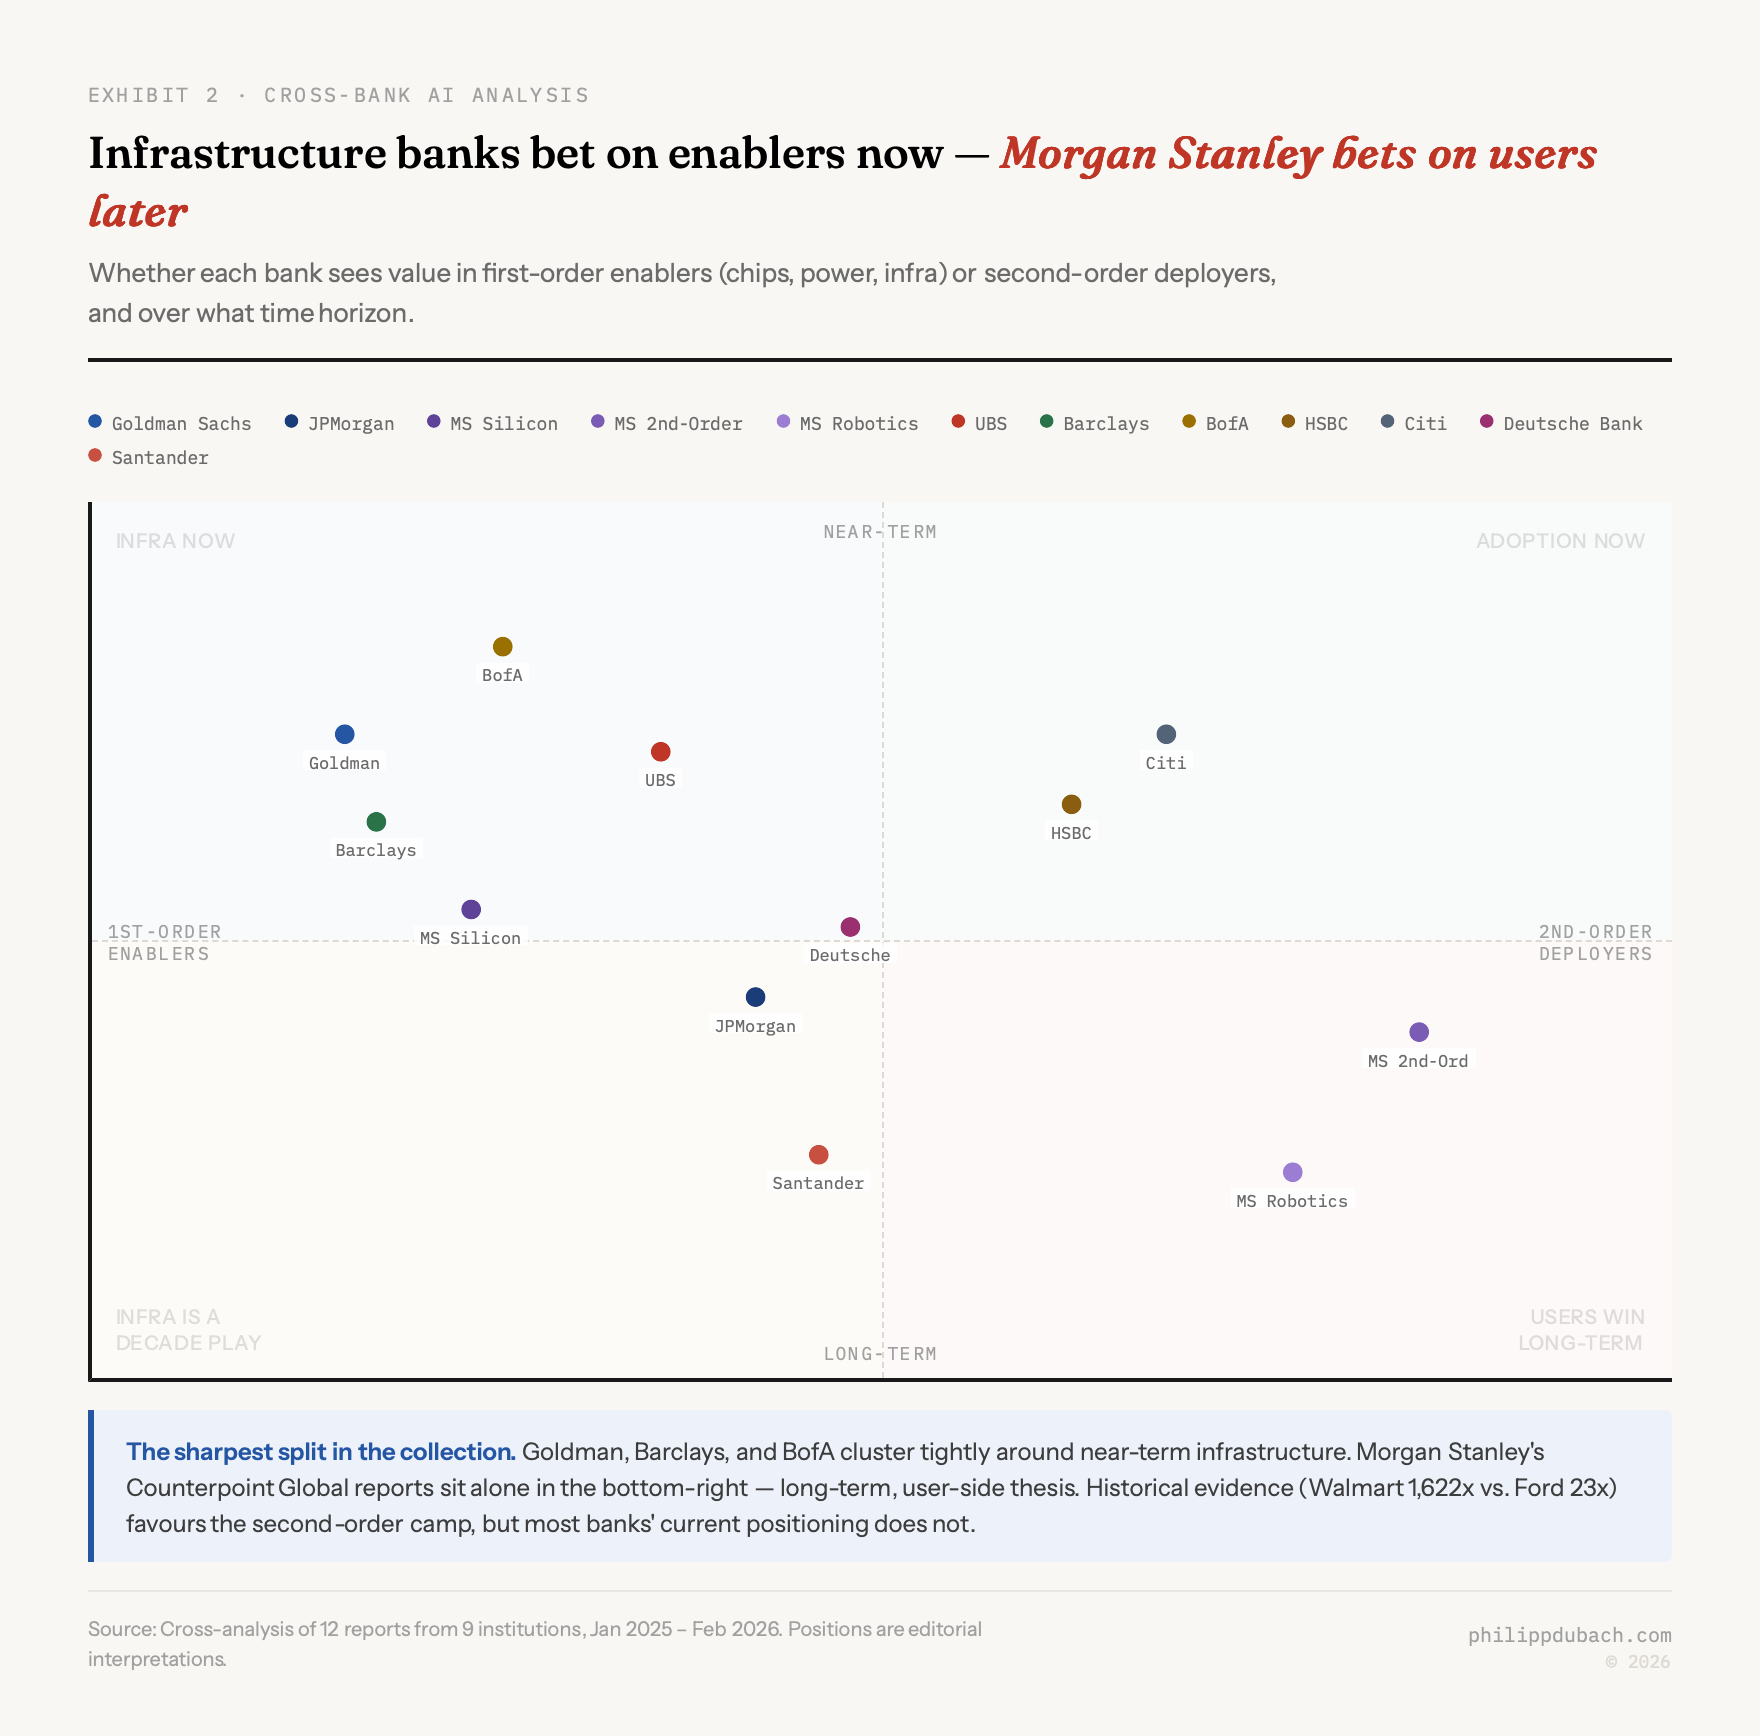
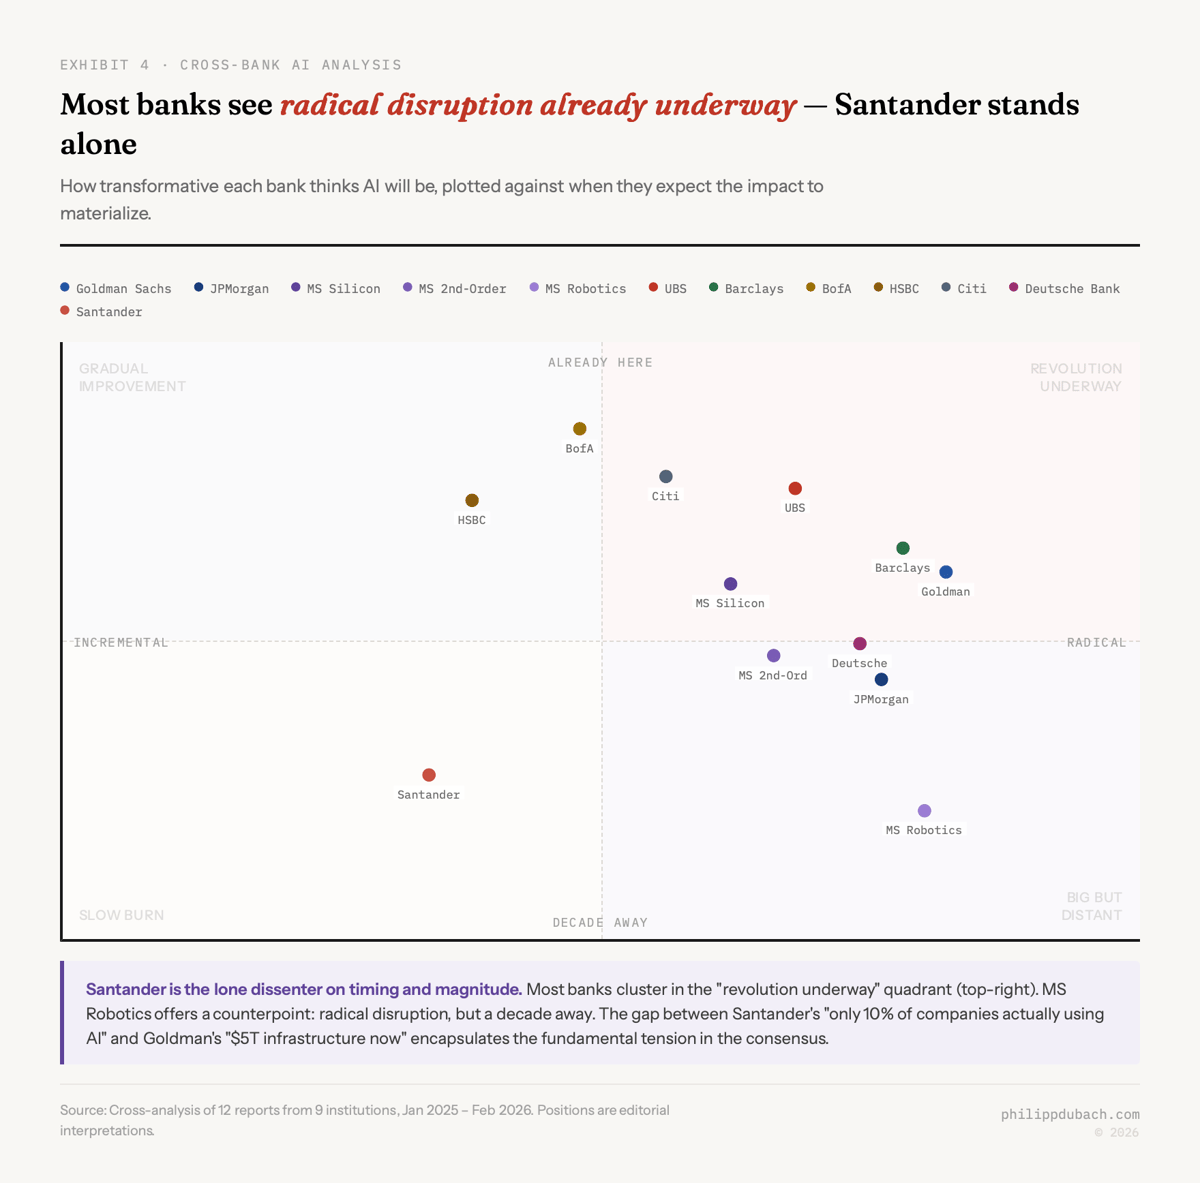

Morgan Stanley’s Counterpoint Global team, in the second-order effects report, presents historical data that should make the rest of this collection at least slightly uncomfortable. In the railroad era, Walmart’s equivalent outperformed Ford’s equivalent by 1,622x to 23x. In the internet era, Netflix returned 519x versus Cisco’s 4x. It’s the same pattern every time: the companies that use the infrastructure to serve customers dramatically outperform the companies that build it.
Yet nearly every bank’s actual investment positioning sits in Nvidia, ASML, hyperscalers, data centre REITs, nuclear utilities, overwhelmingly first-order enablers. Either the historical pattern won’t repeat this time (possible, but not argued anywhere in these reports), or there’s a valid timing explanation (first-order wins in the buildout phase, second-order wins in deployment) or most of these recommendations will look dated within five years.
Morgan Stanley’s own three reports collectively make the case for second-order investing over the long run while still recommending first-order plays in the near term. That’s not quite inconsistent. But the tension deserves more acknowledgment than it gets.
Power
If I had to pick one analytical claim that holds up regardless of where the productivity debate lands, it’s this: power is the binding constraint, and the infrastructure required to relieve it is real, expensive, and already being built.
The numbers are consistent across institutions. US data centre power consumption runs at 150–175 TWh today. Barclays projects 560 TWh by 2030, approximately 13% of total US electricity. Goldman Sachs estimates 60% of new data centre power through 2030 will require net-new generation capacity. The US power grid has an average age of 40 years. Token consumption grew 4,274% in a single year. Data centre construction spending has grown roughly 60% year-on-year since ChatGPT launched in late 2022.
Barclays frames this as a Jevons paradox: efficiency improvements in model inference will, counterintuitively, increase total energy consumption because they make AI cheaper and drive higher usage. I think that’s right. It’s exactly how personal computing and the internet played out. Every report that addresses energy lands on nuclear as the preferred long-term solution: four executive orders in early 2025, a 400 GW capacity target by 2050, the Three Mile Island restart. That consensus may prove correct. It may also be the sector where the infrastructure-before-returns gap runs longest.
What the reports don’t say
The quadrant charts map where the banks are looking. They’re less revealing about what’s off the frame entirely.
No report models a structured downside scenario: AI capex producing disappointing returns, hyperscalers pulling back, or a major data centre financing default triggering something worse. The closest is Santander’s 42% abandonment statistic, but even Santander doesn’t ask what happens if that number climbs to 60%.
No report discusses AI safety or alignment risks. UBS notes that AI task completion duration has doubled every seven months and explicitly references the AGI trajectory, then moves directly to investment implications, as if “AGI trajectory” carries no risk premium at all. I find that strange.
The collision between AI energy demand and climate commitments gets almost no treatment. Only Barclays mentions that global CO2 emissions hit a record 37.7 gigatonnes in 2023. The institutions projecting AI consuming 13% of US electricity by 2030 don’t reconcile that with the net-zero commitments in their own sustainability reports.
JPMorgan, which provides the most detailed geopolitical analysis of the twelve, never models a Taiwan Strait disruption scenario. Morgan Stanley identifies Taiwan, Korea, and China as “irreplaceable” nodes in the AI hardware supply chain, while calling emerging market semiconductor exposure “long-term infrastructure participation.” Those two characterisations sit in very uncomfortable proximity, and neither report acknowledges it.
I came away from this with real respect for several of these pieces, particularly BofA’s empirical rigour and Santander’s willingness to cite unflattering numbers. The energy infrastructure thesis seems to me the most durable of the lot: the power bottleneck is real regardless of where you land on the productivity question.
But I also came away convinced that this consensus is shaped as much by institutional incentive as by analytical independence. When nine institutions with combined AI-related revenue exposure in the hundreds of billions all agree you should increase AI exposure, the interesting question isn’t whether they’re right. They may well be.