Earlier this year I wrote how I built a CGM data reader after wearing a continuous glucose monitor myself. Since I was already logging my macronutrients and learning more about molecular biology in an MIT MOOC, I became curious: given a meal’s macronutrients (carbs, protein, fat) and some basic individual characteristics (age, BMI), could a machine learning model predict the shape of my postprandial glucose curve? I came across Zeevi et al.’s paper on Personalized Nutrition by Prediction of Glycemic Responses, which used machine learning to predict individual glycemic responses from meal data. Exactly what I had in mind. Unfortunately, neither the data nor the code were publicly available. So I decided to build my own model. In the process I wrote this working paper.

The paper documents my attempt to build an open, reproducible glucose prediction pipeline, and what I learned about why that is harder than it sounds. The methodologies employed were largely inspired by Zeevi et al.’s approach. This matters because the landscape of personalized nutrition is increasingly dominated by proprietary systems. Companies like ZOE, DayTwo, and Ultrahuman all run versions of this pipeline on closed data. Open-source alternatives remain scarce.
Why not only use my own data?
I quickly realized that training a model only on my own CGM data was not going to work. Over several weeks of diligent logging, I collected roughly 40 meal-response pairs. To make matters worse, Howard, Guo & Hall (2020) showed that two CGMs worn simultaneously on the same person can give discordant meal rankings for postprandial glucose, meaning some of the variance in the signal is measurement noise, not biology.
To get enough data, I used the publicly available Hall dataset containing continuous glucose monitoring data from 57 adults, which I narrowed down to 112 standardized meals from 19 non-diabetic subjects with their respective glucose curve after the meal (full methodology in the paper).

Gaussian curve fitting
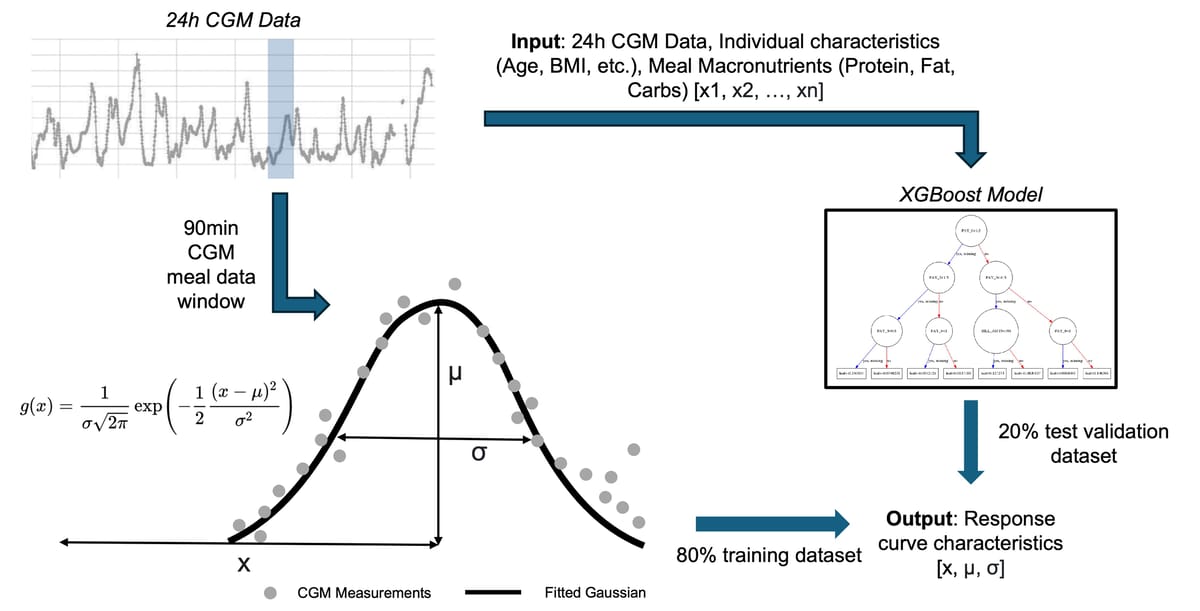
Rather than trying to predict the entire glucose curve, I simplified the problem by fitting each postprandial response to a normalized Gaussian function. This gave me three key parameters to predict: amplitude (how high glucose rises), time-to-peak (when it peaks), and curve width (how long the response lasts).
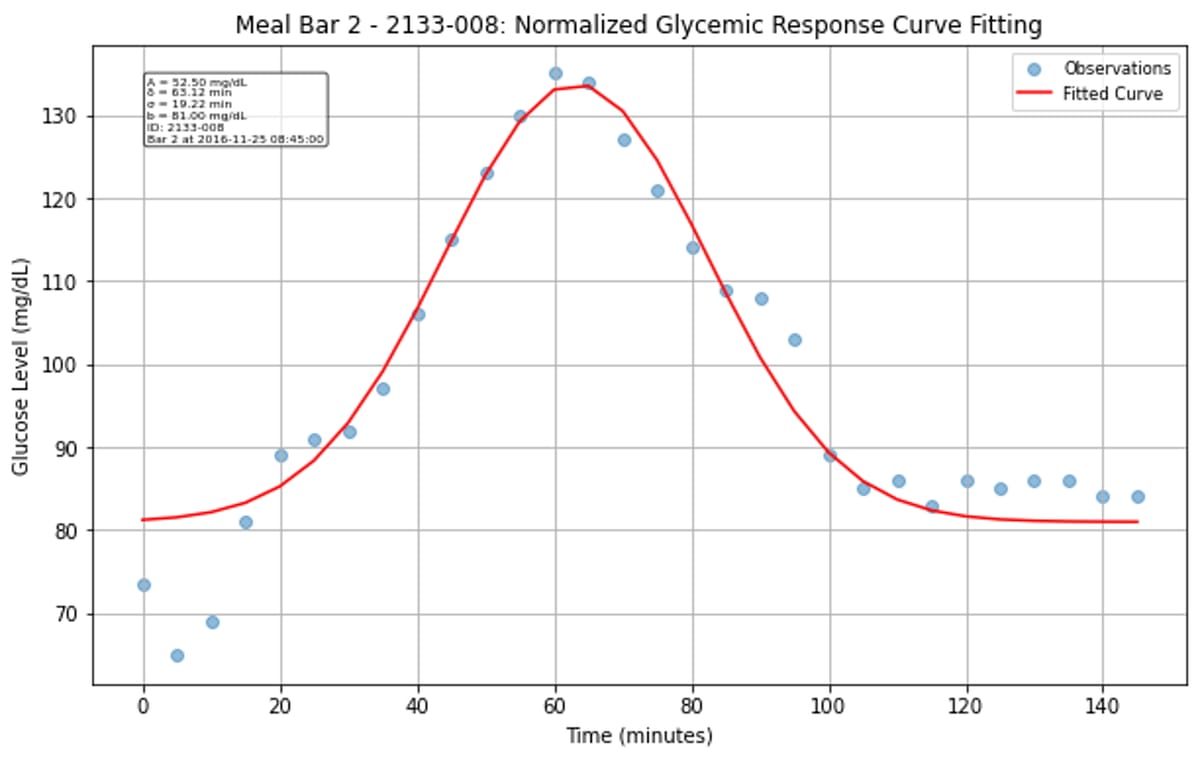

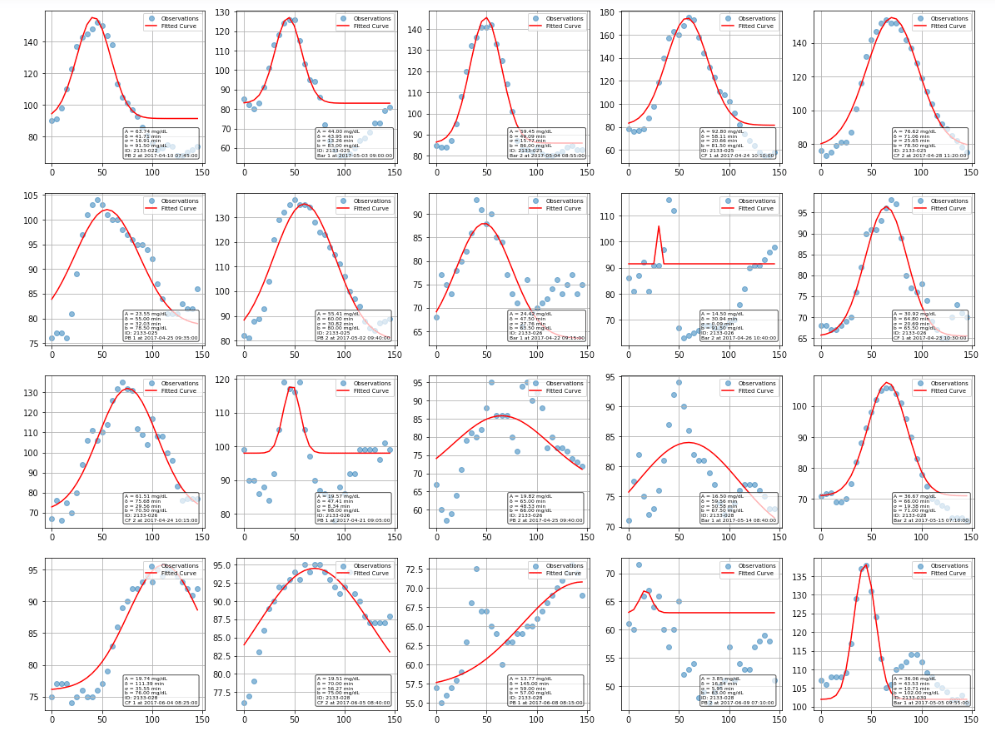
The Gaussian approximation worked surprisingly well for characterizing most glucose responses. While some curves fit better than others, the majority of postprandial responses were well-captured, though there is clear variation between individuals and meals. Some responses were high amplitude, narrow width, while others are more gradual and prolonged.

XGBoost pipeline
I then trained an XGBoost regressor with 27 engineered features including meal composition, participant characteristics, and interaction terms. XGBoost was chosen for its ability to handle mixed data types, built-in feature importance, and strong performance on tabular data. The pipeline included hyperparameter tuning with 5-fold cross-validation to optimize learning rate, tree depth, and regularization parameters. Rather than relying solely on basic meal macronutrients, I engineered features across multiple categories and implemented CGM statistical features calculated over different time windows (24-hour and 4-hour periods), including time-in-range and glucose variability metrics. Architecture-wise, I trained three separate XGBoost regressors, one for each Gaussian parameter.
Results
The model could predict how high my blood sugar rises after a meal with moderate accuracy (R² = 0.46, correlation = 0.73, p < 0.001). Not good enough for clinical guidance, which typically requires R² > 0.7, but meaningfully better than the multi-linear regression baseline (R² = 0.24).
The more telling result is what the model could not do. It had no idea when blood sugar would peak. The time-to-peak prediction was literally worse than guessing the average every time (R² = -0.76, p = 0.896). Curve width prediction was marginally better but still not useful (R² = 0.10). In other words: meal composition tells you something about the magnitude of your glucose spike, but almost nothing about its timing or duration. That is a meaningful finding in itself, consistent with the idea that temporal dynamics are driven by factors like gastric emptying, insulin sensitivity, and gut microbiome composition, none of which were captured in the feature set.
For context, Cappon et al. (2023) trained a similar XGBRegressor on 3,296 meals from 927 healthy individuals and achieved a correlation of r = 0.48 for predicting glycemic response magnitude. Their larger dataset did not dramatically improve over my amplitude correlation of 0.73, but they also found systematic bias in predictions, suggesting that XGBoost captures the general direction well while missing individual-level variation. Separately, Shin et al. (2025) tried a bidirectional LSTM on 171 healthy adults and achieved r = 0.43, worse than XGBoost on amplitude. Deep learning does not automatically win here, especially at small-to-medium dataset sizes. Data quantity matters more than model complexity.
A study on glycemic prediction in pregnant women found that adding gut microbiome data increased explained variance in glucose peaks from 34% to 42%, underscoring that meal composition alone leaves a lot on the table.
The complete code, Jupyter notebooks, processed datasets, and supplementary results are available in my GitHub repository.
(10/06/2025) Update: Today I came across Marcel Salathé’s LinkedIn post on a publication out of EPFL: Personalized glucose prediction using in situ data only.
With data from over 1,000 participants of the Food & You digital cohort, we show that a machine learning model using only food data from myFoodRepo and a glucose monitor can closely track real blood sugar responses to any meal (correlation of 0.71).
As expected, Singh et al. achieve substantially better predictive performance (R = 0.71 vs R² = 0.46). The most critical difference is sample size: their 1,000+ participants versus my 19 (from the Hall dataset). They leveraged the “Food & You” study with high-resolution nutritional intake data from more than 46 million kcal collected across 315,126 dishes, 1,470,030 blood glucose measurements, and 1,024 gut microbiota samples. Both studies use XGBoost, SHAP for interpretability, cross-validation for evaluation, and mathematical approaches to characterize glucose responses (Gaussian curve fitting in my case, incremental AUC in theirs). The methodological overlap is reassuring; what separates the results is data at scale.
The CGMacros dataset (Das et al., Scientific Data, 2025) now provides the first publicly available multimodal dataset with CGM readings, food macronutrients, meal photos, activity data, and microbiome profiles for 45 participants. It even includes an XGBoost example script for predicting postprandial AUC. This is exactly the kind of open resource the field needs more of.