# People Live in Levels, Not Rates
**Author:** Philipp D. Dubach | **Published:** February 28, 2026
**Categories:** Macro
**Keywords:** why economy feels bad, vibecession 2026, prices still high inflation down, Jon Stewart Richard Thaler debate 2026, K-shaped economy wages 2026, cumulative inflation since 2020, levels vs rates problem inflation, vibepression 2026, consumer sentiment disconnect, grocery prices since pandemic, housing affordability crisis 2026, economic perception gap, real wage growth by income level, nudge theory effectiveness meta-analysis, essentials squeeze affordability, economics communication failure, behavioral economics trust crisis, why economy feels bad when data is good
## Key Takeaways
- Cumulative CPI is up ~25% since 2020 (groceries up 29.4%, housing up 30-45%) and none of it reverses when inflation falls to 2.4%
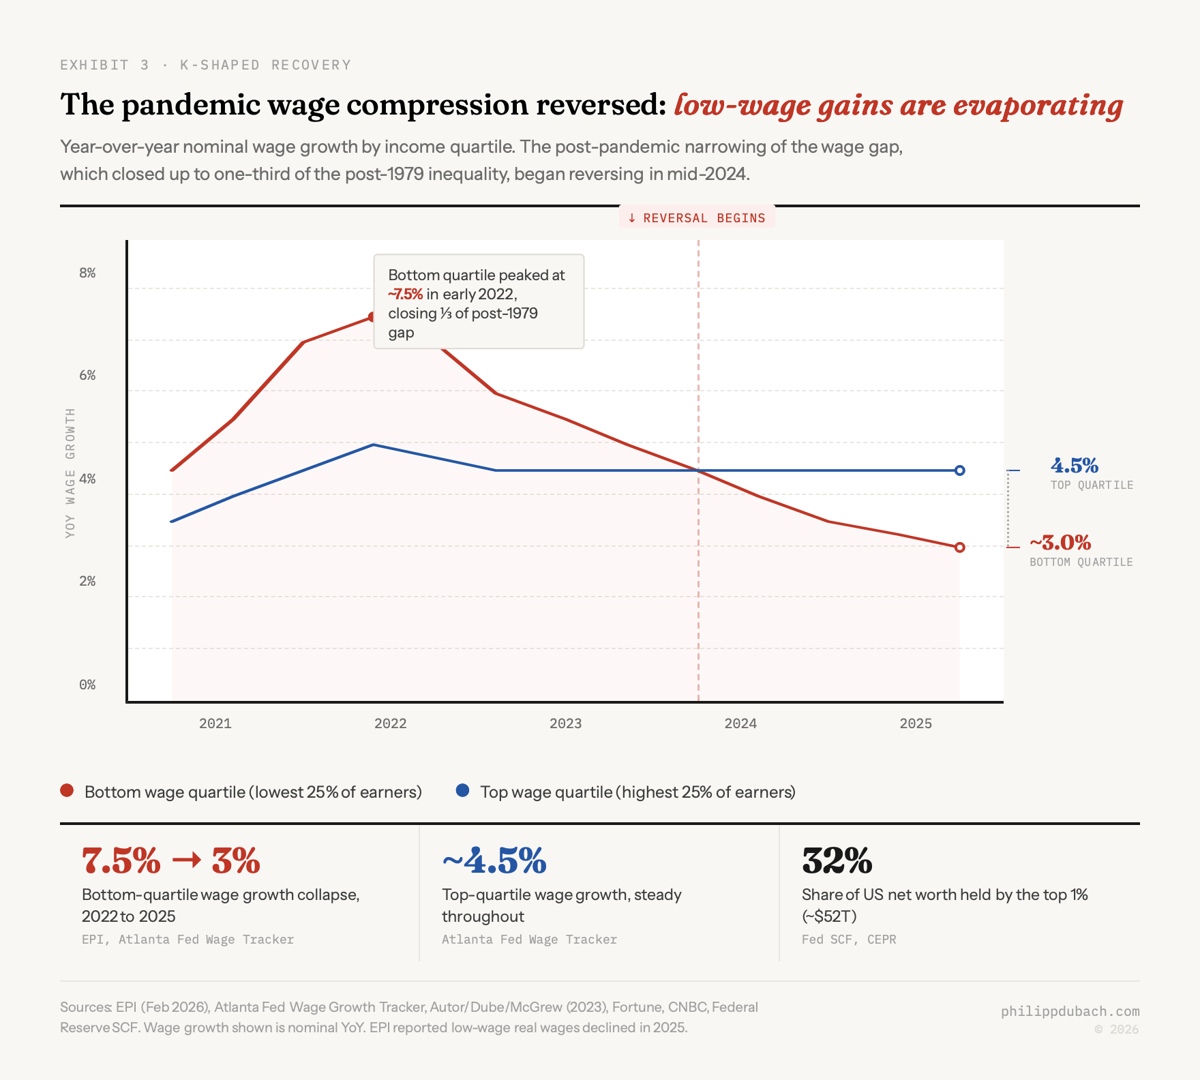
- Bottom-quartile wage growth collapsed from 7.5% to 3.5% in 2025, reversing pandemic-era compression that had closed a third of the post-1979 inequality gap
- Consumer sentiment is at the 3rd percentile of its historical range despite 4.4% GDP growth, not irrational pessimism but a measurement problem
- Stewart reinvented the carbon tax while arguing against the economist who proposed it, the economics communication problem in 92 minutes
---
>Economics doesn't take into account what's best for society. The goal of economics in a capitalist system is to make the most amount of money for your shareholders.
That's Jon Stewart, [telling a Nobel laureate](https://podcasts.apple.com/us/podcast/the-irrational-economy-with-richard-thaler/id1583132133?i=1000747991551) what his own field is about. On February 4, Stewart hosted Richard Thaler on "The Weekly Show" to discuss behavioral economics. Thaler, the Chicago Booth professor who won the 2017 Nobel for [his work on how real humans deviate from rational-agent models](https://news.uchicago.edu/story/richard-thaler-wins-nobel-prize-his-contributions-behavioural-economics), spent 92 minutes patiently explaining things Stewart had already decided weren't true. [Jason Furman](https://x.com/jasonfurman/status/2021395695081750874), Harvard professor and former Obama CEA chair, called it "the single worst interview I've ever done" (referencing his own 2024 Stewart appearance). That tweet hit 754,000 views. [Jerusalem Demsas](https://www.theargumentmag.com/p/jon-stewart-has-become-his-own-worst) wrote the sharpest rebuttal, arguing Stewart "has no idea what economics actually is."
The pile-on was deserved in its specifics and wrong in its framing. Stewart got basic things wrong. He also pointed at something real that the profession keeps failing to address.
## The carbon tax moment
The episode's most telling exchange involved climate policy. Thaler offered the textbook answer: a carbon tax. [Every economist agrees on this](https://singjupost.com/the-irrational-economy-w-nobel-laureate-richard-thaler-transcript/), Thaler said, and he's roughly right. Stewart rejected it on political grounds: the moment energy prices rise, voters punish the party in power. Fair enough. But then Stewart [proposed his own solution](https://podcasts.happyscribe.com/the-weekly-show-with-jon-stewart/the-irrational-economy-with-richard-thaler): "create a model that creates robust markets in damage mitigation and carbon mitigation." Thaler paused. That is a carbon tax. Stewart had arrived at the standard economic answer while believing he was overturning it.
This moment captures the entire problem. Stewart's instinct, that political feasibility should constrain policy design, is not a "bizarre non sequitur" as some economists claimed. It's the reason we don't have a carbon tax. But his conviction that economics as a discipline has nothing to say about society's wellbeing is wrong in a way that matters. Thaler's own career is a direct counterexample: behavioral nudges have [enrolled 10 million UK workers](https://www.bi.team/about-us/who-we-are/) into pension savings, and Thaler [told Stewart](https://singjupost.com/the-irrational-economy-w-nobel-laureate-richard-thaler-transcript/) that renaming an ACA plan tier from "catastrophic" to "economy" cut the uninsured rate by **10%**. But I think the economists who piled on Stewart missed the more interesting question he was circling: if the economy is working well by standard measures, why does it feel broken to so many people? The answer is what I'd call the levels-vs-rates problem, and it explains both the vibecession and the trust gap between economists and the public they claim to serve.
## Levels-vs-rates disconnect
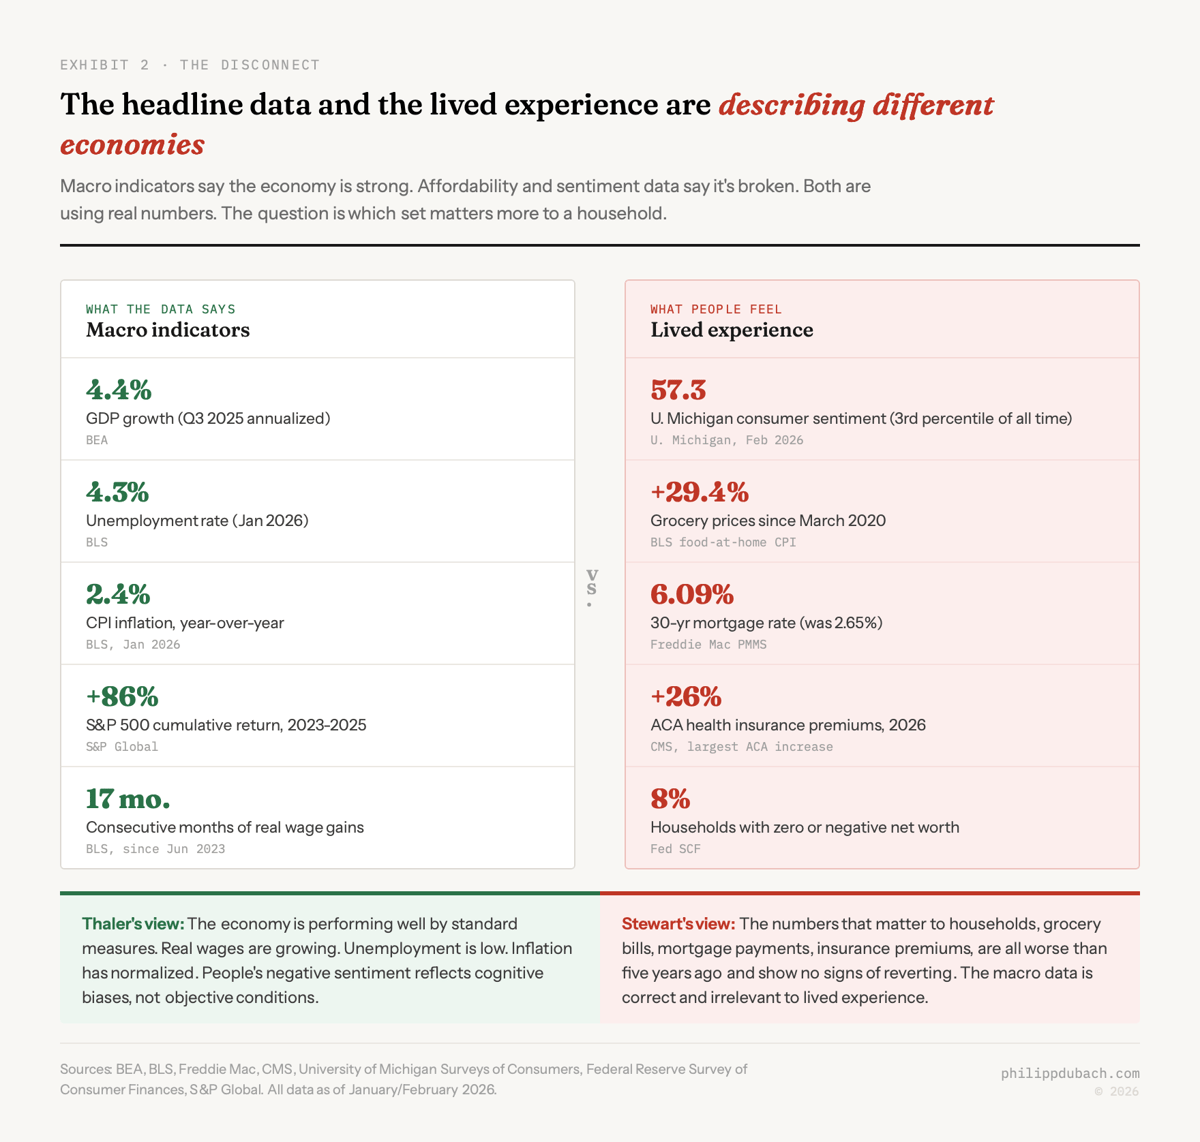
The headline data is strong. [GDP grew 4.4% annualized in Q3 2025](https://www.bea.gov/news/2026/gross-domestic-product-3rd-quarter-2025-updated-estimate-gdp-industry-and-corporate). [Unemployment sits at 4.3%](https://tradingeconomics.com/united-states/unemployment-rate). [Inflation has fallen to 2.4%](https://www.cnbc.com/2026/02/13/heres-the-inflation-breakdown-for-january-2026-in-one-chart.html), with core CPI at 2.5%, its lowest since April 2021. Real wages have outpaced inflation every month since June 2023. The S&P 500 posted [three consecutive years of double-digit gains](https://www.fool.com/investing/2026/01/22/the-sp-500-just-did-something-weve-never-seen-befo/), returning 86% cumulative. An economist looking at these numbers would say the economy is performing well. Thaler more or less said exactly that.
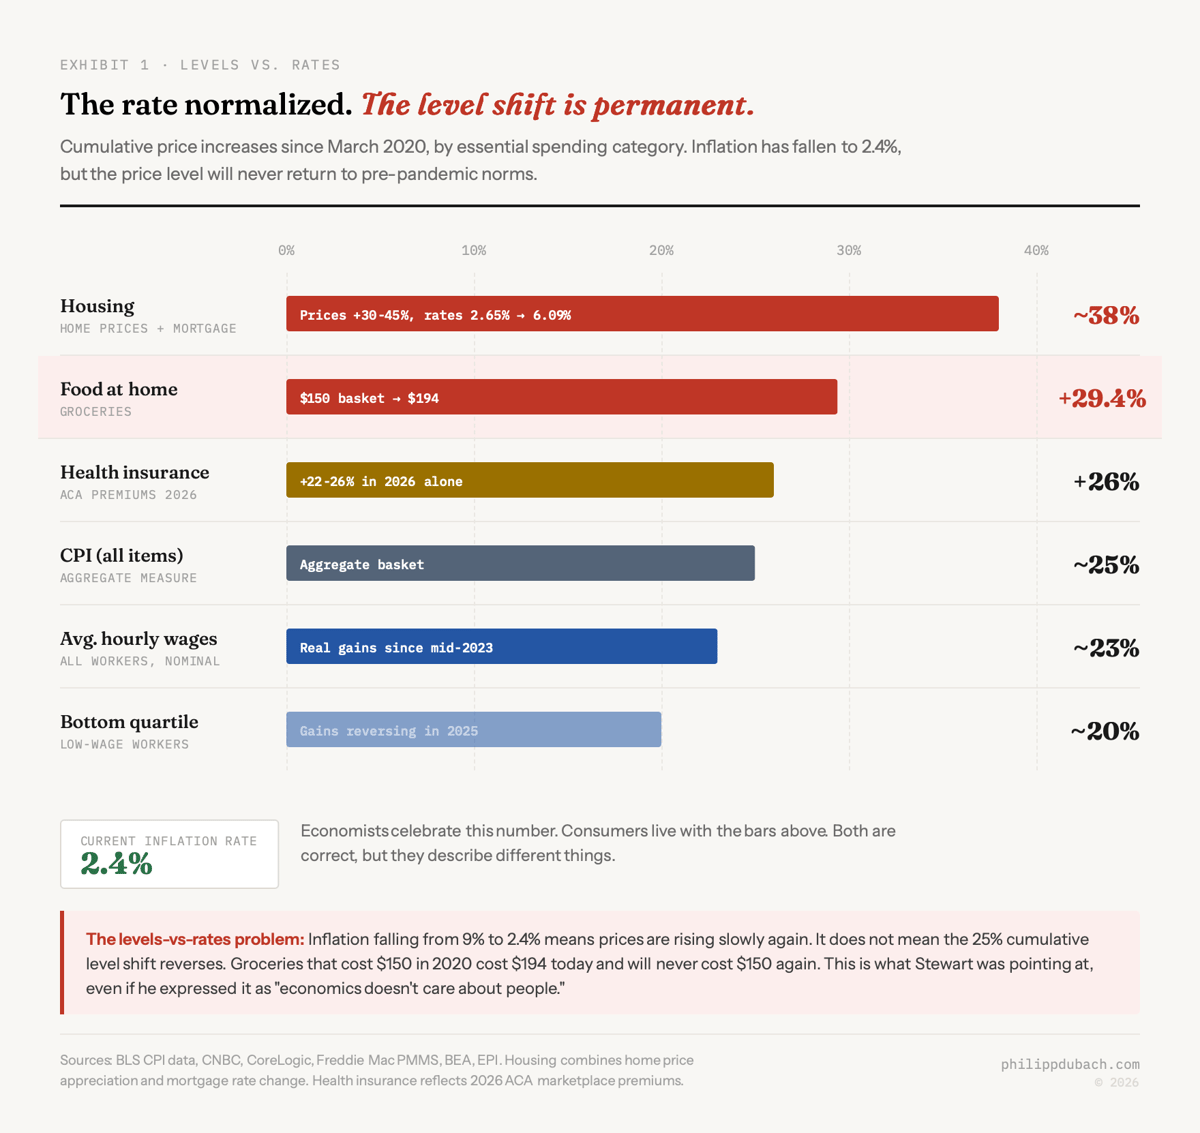
But rates and levels are different things, and people live in levels. The cumulative CPI increase since early 2020 is roughly **25%**. [Food-at-home prices are up 29.4% since March 2020](https://www.traceone.com/resources/plm-compliance-blog/grocery-store-items-that-have-increased-most-in-price). The $150 grocery bill became $186 and will never go back to $150. [Housing affordability is at its lowest point since the 1980s](https://www.cotality.com/insights/articles/2025-housing-market-moderation-and-rebalancing), with home prices up 30-45% from pre-pandemic levels and [mortgage rates near 6%](https://www.freddiemac.com/pmms), more than double the 2.65% pandemic low. [ACA marketplace premiums rose 21.7-26% for 2026](https://time.com/7327333/health-insurance-costs-increasing-2026/), the largest increase in nearly a decade. The rate of change has normalized. The level shift is permanent.
This is what Stewart was gesturing at. He expressed it as "economics doesn't care about people," which is wrong. What he actually meant: the metrics economists use to declare success (rates of change, aggregate growth, unemployment) don't capture what households experience at the grocery store, the mortgage broker, or the insurance renewal. The economic perception gap isn't irrational. It's a measurement problem.
## K-shaped wages: the recovery that reversed
The distributional story makes both sides' aggregate claims misleading. [The Economic Policy Institute reported](https://www.epi.org/blog/low-wage-workers-faced-worsening-affordability-in-2025/) in February 2026 that low-wage workers' real wages declined in 2025, ending five years of historically fast gains. High earners held steady at 4.5% wage growth. [The lowest-income quartile fell from 7.5% to roughly 3.5%](https://fortune.com/2025/11/10/k-shaped-economy-wage-growth-wealthiest-poorest-americans-diverge/). The pandemic-era wage compression that closed up to one-third of the post-1979 wage gap, documented by Autor, Dube, and McGrew in their 2023 paper, has reversed. [CNBC reported](https://www.cnbc.com/2026/01/30/wealth-inequality-k-shaped-economy-united-states-consumer-spending-trump.html) that the top 1% now hold roughly 32% of US net worth (about $52 trillion), while the bottom 50% hold 2.5%. Eight percent of American households have zero or negative net worth.
The [University of Michigan consumer sentiment index](https://www.advisorperspectives.com/dshort/updates/2026/02/06/consumer-sentiments-marginal-gains-six-month-peak-still-feels-like-a-valley) sits at 57.3: the 3rd percentile of its entire historical range. The [Conference Board's Consumer Confidence Index hit 84.5 in January](https://markets.financialcontent.com/stocks/article/marketminute-2026-2-11-the-great-sentiment-schism-us-consumer-confidence-hits-12-year-low-amid-radical-partisan-divide), a 12-year low. Charles Schwab's Kevin Gordon [coined the term "vibepression"](https://finance.yahoo.com/video/economic-data-isnt-moving-sentiment-190033538.html) in December 2025 as sentiment hit new lows. Kyla Scanlon's [original "vibecession" concept from 2022](https://www.mercatus.org/macro-musings/kyla-scanlon-vibecession-vibe-economy-and-path-growing-american-wealth) never actually resolved; it just got a bleaker name.
I'm not sure consumer sentiment surveys mean much anymore. A [50-point partisan gap](https://markets.financialcontent.com/stocks/article/marketminute-2026-2-11-the-great-sentiment-schism-us-consumer-confidence-hits-12-year-low-amid-radical-partisan-divide) between Republicans and Democrats renders the aggregate figure almost meaningless as an economic indicator. It tells you about political identity, not lived experience. But the affordability data underneath the sentiment numbers is not a polling artifact. [Mike Konczal's February 2026 analysis](https://newsletter.mikekonczal.com/p/why-affordability-and-the-vibecession) showed that budget shares devoted to essentials, food, shelter, transportation, and healthcare, have increased even as aggregate real incomes recovered. He called this the "essentials squeeze," and dismissed the standard economist response ("it's just money illusion") as inadequate. I think he's right.
## Economists' communication problem
The [Nominal News](https://www.nominalnews.com/p/jon-stewart-thaler-economics-debate) author, a PhD economist, made the argument I find most persuasive: Stewart's view of economics is wrong, but the reason he holds it is because the profession has failed to distinguish between what it actually does and the policy opinions individual economists express in op-eds and cable news appearances. When a prominent economist dismisses wealth taxes by citing implementation costs as if costs alone settle the question, they're blending analysis with preference. Do that enough times, and people like Stewart conclude that the entire field is an exercise in defending the status quo.
[Demsas catalogued](https://www.theargumentmag.com/p/jon-stewart-has-become-his-own-worst) economics' accomplishments: Alvin Roth's kidney exchange, RCTs delivering tutoring to 5 million Indian children, longer intervals between recessions. These are real. But the profession's most visible public-facing moments, failing to predict 2008, designing a response perceived as rescuing banks over households, insisting the economy is strong while consumer sentiment sits near all-time lows, have eroded trust in ways that one good Substack post can't repair.
Stewart then [brought on Oren Cass](https://singjupost.com/the-wealth-of-wall-street-with-oren-cass-transcript/) to discuss financialization, which [prompted Demsas to write](https://www.theargumentmag.com/p/jon-stewart-has-become-his-own-worst): "Damn, I felt bad for a second but Stewart may be beyond help." The irony is thick. The populist left (Stewart) and the populist right (Cass) are making the same structural complaint about economics from opposite directions. Stewart says economics serves capital. Cass says economics serves free trade orthodoxy. Both are wrong about the discipline and right that its public-facing representatives have blurred the line between analysis and advocacy for decades.
Here's where I land. Nudge theory [works in specific, bounded domains](https://www.sciencenews.org/article/nudge-theory-behavioral-science-psychology-structural-change): default enrollment, plan labeling, organ donation opt-outs. A [meta-analysis by Maier et al.](https://theconversation.com/nudge-theory-what-15-years-of-research-tells-us-about-its-promises-and-politics-210534) found that real-world nudges increase desired behavior by an average of **1.4 percentage points** after correcting for publication bias, versus 8.7 in lab settings. Useful but limited. Stewart's "nudge vs. shove" framing is crude. Thaler's point that mandates become dangerous when political control shifts ("Sometimes Trump is President") is underrated. But neither addressed the actual hard question: what do you do about a permanent 25% price level shift in essentials that no nudge can reverse and no rate-of-change metric captures?
I don't think anyone has a good answer to that. The economists who piled on Stewart for not understanding Pigouvian taxation weren't wrong. They just weren't answering the question their audience was asking.
---
## Frequently Asked Questions
### Why does the economy feel bad when inflation is down?
The economy feels bad because people experience price levels, not rates of change. Inflation fell from 9% to 2.4%, but cumulative prices rose roughly 25% since 2020, with groceries up 29.4% and housing affordability at its lowest since the 1980s. Economists celebrate the rate normalizing; consumers live with the permanent level shift. This levels-vs-rates disconnect is the structural explanation for the vibecession.
### What is the levels-vs-rates problem in economics?
The levels-vs-rates problem describes a disconnect between how economists measure inflation (year-over-year rate of change) and how consumers experience it (cumulative price level). Inflation falling to 2.4% means prices are rising slowly again. It does not mean the 25% cumulative increase since 2020 reverses. A grocery bill that cost $150 in 2020 costs $194 today and will never cost $150 again.
### What did Jon Stewart say about economics to Richard Thaler?
On February 4, 2026, Stewart hosted Nobel laureate Thaler on 'The Weekly Show' to discuss behavioral economics. Stewart argued that economics exists to maximize shareholder value and dismissed nudge theory as inadequate for systemic problems. He then unknowingly proposed a carbon tax, the exact policy he had just rejected, while believing he was contradicting Thaler. The episode triggered a fierce backlash from economists including Jason Furman and Jerusalem Demsas.
### What is vibepression and how does it relate to the vibecession?
Vibepression is a term coined by Charles Schwab's Kevin Gordon in December 2025 to describe the deepening of the vibecession, a concept Kyla Scanlon introduced in June 2022. As of February 2026, the University of Michigan consumer sentiment index sits at 57.3, the 3rd percentile of its historical range, despite GDP growth of 4.4% and unemployment of 4.3%. The vibecession never resolved; it got a bleaker name.
### Are real wages outpacing inflation in 2026?
In aggregate, yes, since June 2023. But the distribution is K-shaped: high earners held 4.5% wage growth while the bottom quartile fell from 7.5% to roughly 3.5%. The Economic Policy Institute reported in February 2026 that low-wage workers' real wages actually declined in 2025, reversing pandemic-era compression that had closed up to one-third of the post-1979 wage gap.
### Will prices go back to pre-pandemic levels?
No. Prices will not return to pre-pandemic levels. Cumulative CPI is up roughly 25% since early 2020, with food-at-home up 29.4% and housing costs up 30-45%. Reversing this would require sustained deflation, which central banks actively prevent because falling price levels cause recessions. The inflation rate has normalized at 2.4%, but the level shift is permanent.
### How effective are behavioral nudges according to research?
Less effective than widely believed. A meta-analysis by Maier et al. found that after correcting for publication bias, real-world nudges increase desired behavior by just 1.4 percentage points, compared to 8.7 in lab settings. A 2025 second-order meta-analysis by Hu found nudge effects drop to near zero (d=0.004) after full bias correction. Specific applications like pension auto-enrollment show larger effects, but the average impact is far smaller than proponents claim.
---
*Philipp D. Dubach — [http://philippdubach.com/](http://philippdubach.com/) — 2026*