# Variance Tax

**Author:** Philipp D. Dubach | **Published:** February 6, 2026 | **Updated:** February 23, 2026
**Categories:** Quantitative Finance
**Keywords:** variance drain, volatility drag, geometric vs arithmetic returns, leveraged ETF decay, Kelly criterion

## Key Takeaways

- Variance drain equals ½σ²: doubling volatility quadruples the cost to compound returns
- The Kelly criterion (L* = (μ-r)/σ²) falls directly out of the variance drain formula, giving the leverage that maximizes compound growth
- Half-Kelly sizing sacrifices ~25% of theoretical growth but dramatically reduces drawdown risk from estimation error
- Same 10% arithmetic return at 50% vol loses more than half your money over 30 years; at 0% vol it reaches $1,745

---


Let's say your portfolio returned +60% in 2024, then fell 40% in 2025. That's an annualized average return of +10%. Actual return after two years: minus 4% (i.e $100 * 1.6 * 0.6 = $96).

That 14-point gap is what we call the variance tax aka [variance drain](https://www.bogleheads.org/wiki/Variance_drain) or volatility drag and it's one of the least intuitive forces in investing.

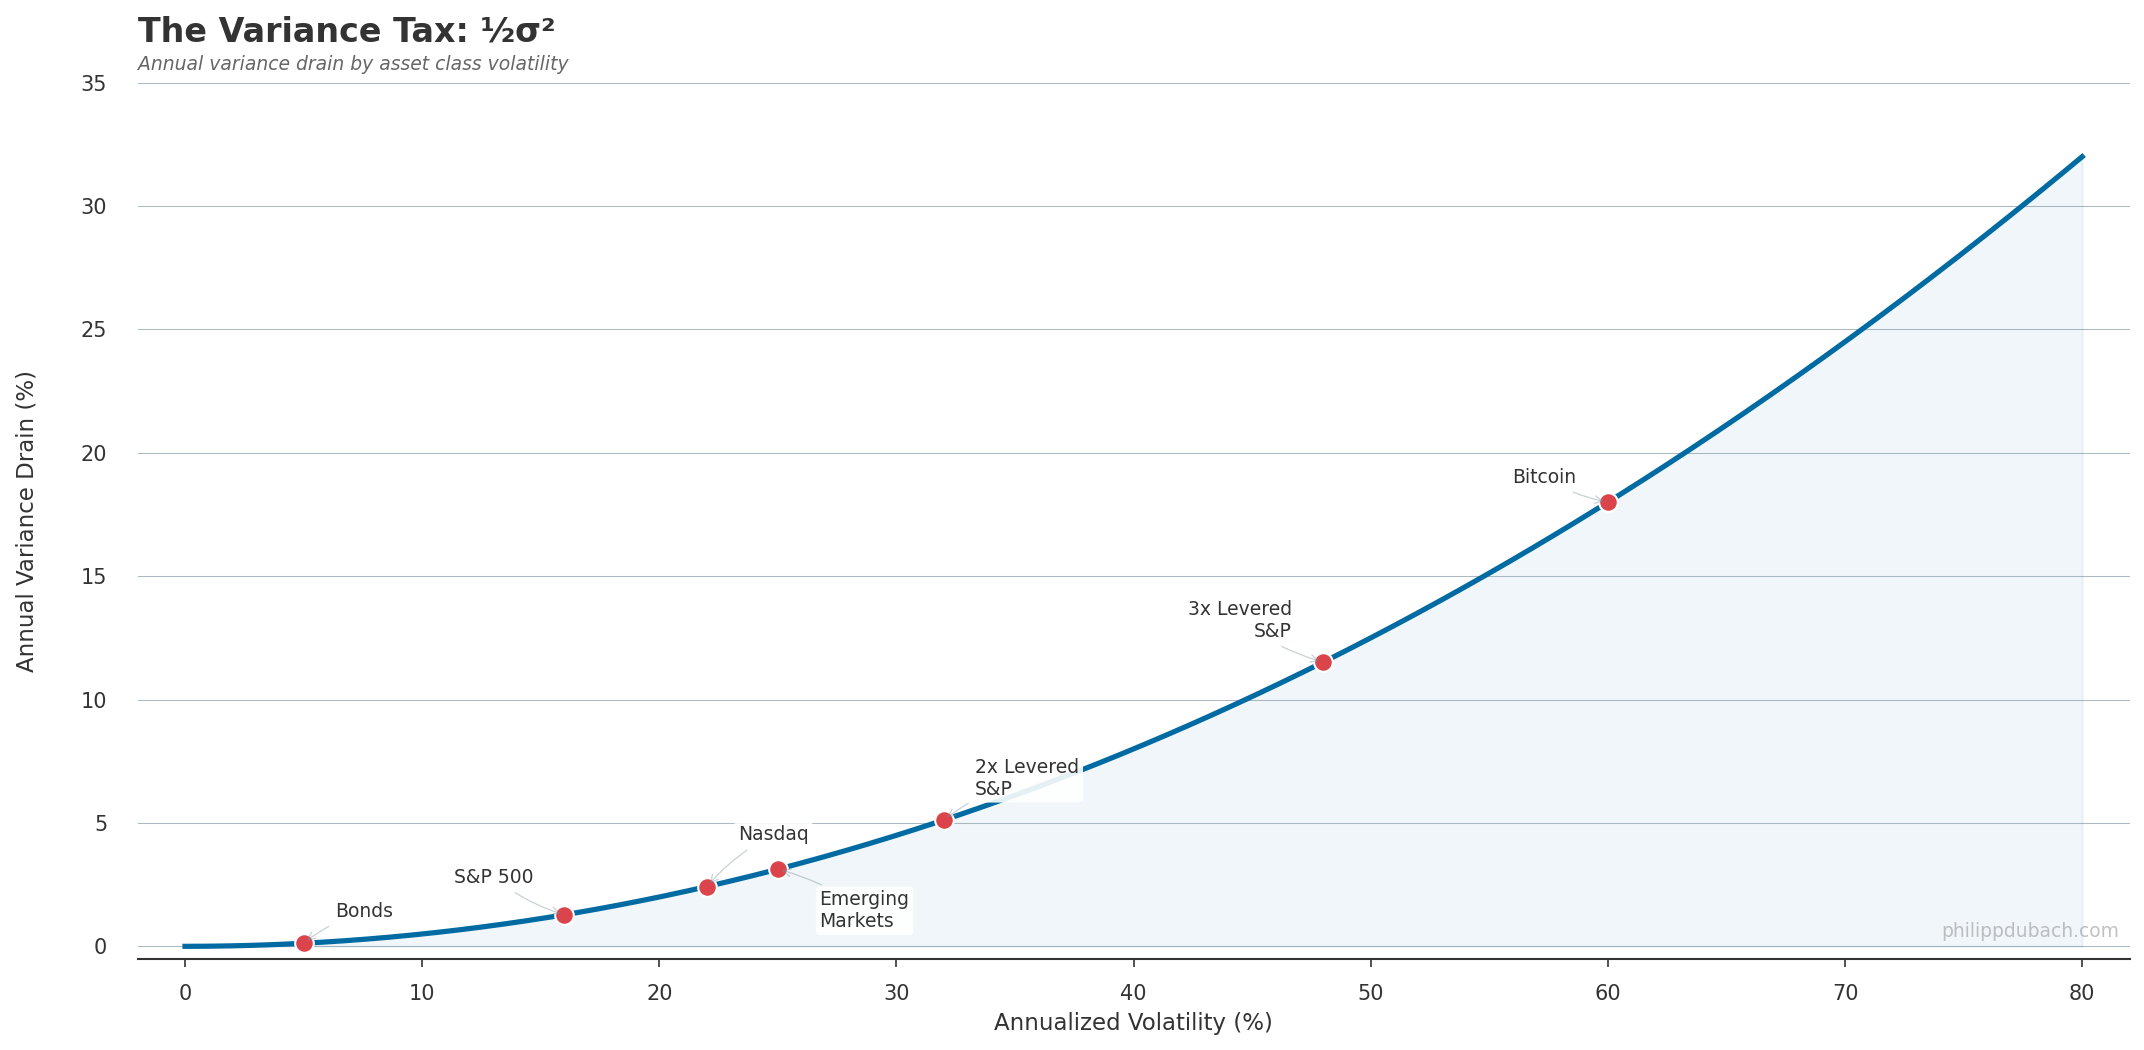
Take any series of returns with arithmetic mean μ and volatility σ. The compound growth rate, the one that actually determines your wealth, is approximately:

$$G ≈ μ − ½σ²$$

This comes from a [second-order Taylor expansion](https://en.wikipedia.org/wiki/Taylor%27s_theorem#Example) of ln(1+r). Take expectations, and the mean log return equals the arithmetic mean minus half the variance. Everything else drops out. Half the variance. That is the tax. The same correction term appears when you solve [geometric Brownian motion](https://en.wikipedia.org/wiki/Geometric_Brownian_motion) via [Itô's lemma](https://en.wikipedia.org/wiki/It%C3%B4%27s_lemma) (the drift of log(S) is μ − σ²/2, not μ) so whether you come at it from discrete compounding or continuous-time stochastic calculus, you land in the same place. And because it is quadratic, doubling volatility does not double the cost. It quadruples it. And what we learned during covid, if anything at all, is that we generally [have a hard time to mentally abstract exponential growth](https://journals.plos.org/plosone/article?id=10.1371/journal.pone.0242839) rates.<a href="#lightbox-variance_drain_by_vol-png-0" style="display: block; width: 80%; margin: 0 auto; padding: 1.5rem 0; text-decoration: none;">
  <picture class="img-lightbox">
    
    <source media="(max-width: 768px)" 
            srcset="https://static.philippdubach.com/cdn-cgi/image/width=320,quality=80,format=webp/variance_drain_by_vol.png 320w,
                    https://static.philippdubach.com/cdn-cgi/image/width=480,quality=80,format=webp/variance_drain_by_vol.png 480w,
                    https://static.philippdubach.com/cdn-cgi/image/width=640,quality=80,format=webp/variance_drain_by_vol.png 640w,
                    https://static.philippdubach.com/cdn-cgi/image/width=960,quality=80,format=webp/variance_drain_by_vol.png 960w,
                    https://static.philippdubach.com/cdn-cgi/image/width=1200,quality=80,format=webp/variance_drain_by_vol.png 1200w"
            sizes="80vw">
    
    
    <source media="(max-width: 1024px)" 
            srcset="https://static.philippdubach.com/cdn-cgi/image/width=768,quality=80,format=webp/variance_drain_by_vol.png 768w,
                    https://static.philippdubach.com/cdn-cgi/image/width=1024,quality=80,format=webp/variance_drain_by_vol.png 1024w,
                    https://static.philippdubach.com/cdn-cgi/image/width=1440,quality=80,format=webp/variance_drain_by_vol.png 1440w"
            sizes="80vw">
    
    
    <source media="(min-width: 1025px)" 
            srcset="https://static.philippdubach.com/cdn-cgi/image/width=1200,quality=80,format=webp/variance_drain_by_vol.png 1200w,
                    https://static.philippdubach.com/cdn-cgi/image/width=1600,quality=80,format=webp/variance_drain_by_vol.png 1600w,
                    https://static.philippdubach.com/cdn-cgi/image/width=2000,quality=80,format=webp/variance_drain_by_vol.png 2000w"
            sizes="80vw">
    
    
    <img src="https://static.philippdubach.com/cdn-cgi/image/width=1200,quality=80/variance_drain_by_vol.png" 
         alt="Chart showing the variance tax as a quadratic curve ½σ², with labeled data points for Bonds (5% vol, 0.1% drain), S&amp;P 500 (16%, 1.3%), Nasdaq (22%, 2.4%), Emerging Markets (25%, 3.1%), 2x Leveraged S&amp;P (32%, 5.1%), 3x Leveraged S&amp;P (48%, 11.5%), and Bitcoin (60%, 18%)" 
         class=""
         width="1200"
         height="630"
         loading="lazy"
         decoding="async"
         style="width: 100%; height: auto; display: block;">
  </picture>
</a>


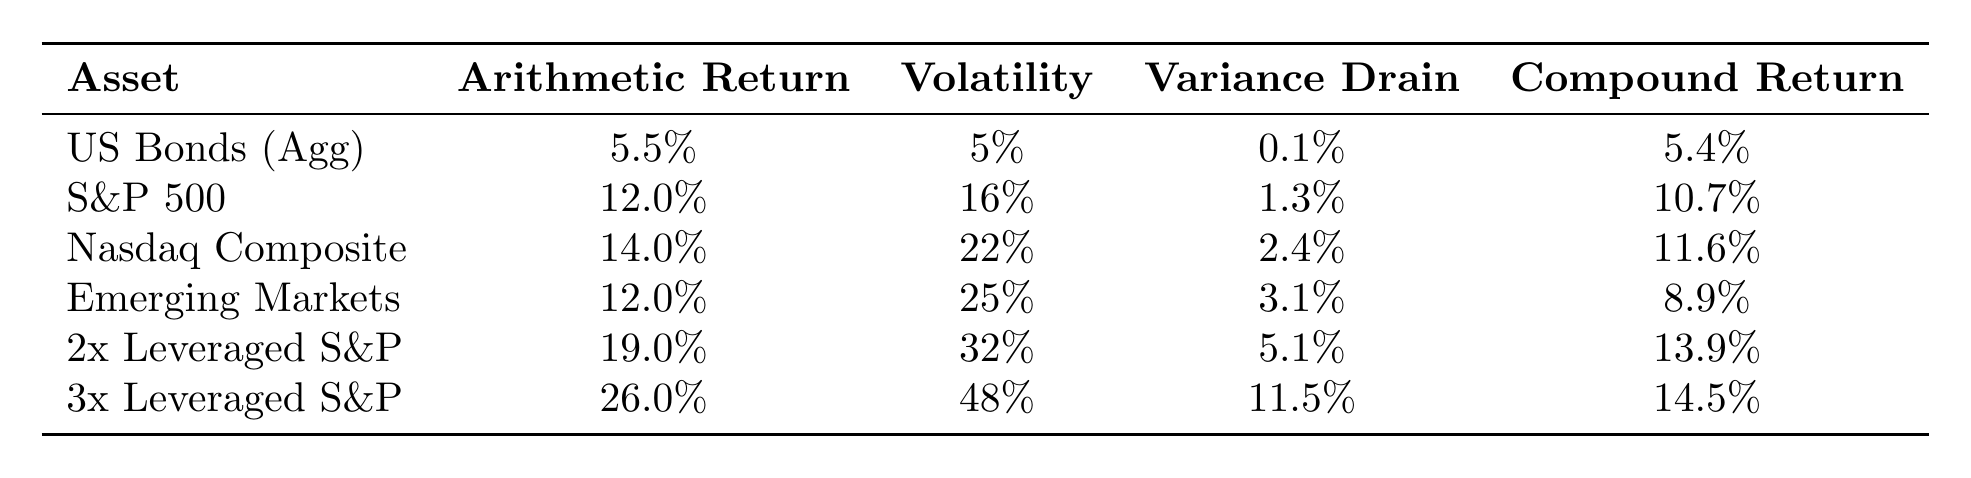
 Treasury bonds at 5% vol pay about 0.1% per year in variance drain. Barely noticeable. The S&P 500 at 16% vol pays 1.3%. A 3x leveraged ETF at 48% vol pays 11.5%. [Jacquier, Kane, and Marcus (2003)](https://people.bu.edu/jacquier/papers/geom.faj0312.pdf) studied S&P 500 returns from 1926 to 2001: arithmetic mean 12.49%, geometric mean 10.51%. The gap is 1.98 percentage points. The formula predicts ½ × 0.203² = 2.06%. <a href="#lightbox-variance_table-png-1" style="display: block; width: 80%; margin: 0 auto; padding: 1.5rem 0; text-decoration: none;">
  <picture class="img-lightbox">
    
    <source media="(max-width: 768px)" 
            srcset="https://static.philippdubach.com/cdn-cgi/image/width=320,quality=80,format=webp/variance_table.png 320w,
                    https://static.philippdubach.com/cdn-cgi/image/width=480,quality=80,format=webp/variance_table.png 480w,
                    https://static.philippdubach.com/cdn-cgi/image/width=640,quality=80,format=webp/variance_table.png 640w,
                    https://static.philippdubach.com/cdn-cgi/image/width=960,quality=80,format=webp/variance_table.png 960w,
                    https://static.philippdubach.com/cdn-cgi/image/width=1200,quality=80,format=webp/variance_table.png 1200w"
            sizes="80vw">
    
    
    <source media="(max-width: 1024px)" 
            srcset="https://static.philippdubach.com/cdn-cgi/image/width=768,quality=80,format=webp/variance_table.png 768w,
                    https://static.philippdubach.com/cdn-cgi/image/width=1024,quality=80,format=webp/variance_table.png 1024w,
                    https://static.philippdubach.com/cdn-cgi/image/width=1440,quality=80,format=webp/variance_table.png 1440w"
            sizes="80vw">
    
    
    <source media="(min-width: 1025px)" 
            srcset="https://static.philippdubach.com/cdn-cgi/image/width=1200,quality=80,format=webp/variance_table.png 1200w,
                    https://static.philippdubach.com/cdn-cgi/image/width=1600,quality=80,format=webp/variance_table.png 1600w,
                    https://static.philippdubach.com/cdn-cgi/image/width=2000,quality=80,format=webp/variance_table.png 2000w"
            sizes="80vw">
    
    
    <img src="https://static.philippdubach.com/cdn-cgi/image/width=1200,quality=80/variance_table.png" 
         alt="Table showing variance drain by asset class: US Bonds (5% vol, 0.1% drain), S&amp;P 500 (16% vol, 1.3% drain), Nasdaq (22% vol, 2.4% drain), Emerging Markets (25% vol, 3.1% drain), 2x Leveraged S&amp;P (32% vol, 5.1% drain), 3x Leveraged S&amp;P (48% vol, 11.5% drain)" 
         class=""
         width="1200"
         height="630"
         loading="lazy"
         decoding="async"
         style="width: 100%; height: auto; display: block;">
  </picture>
</a>


 Looking at the last row, we see that tripling leverage triples the arithmetic return but delivers nearly the same compound return as 2x. The linear gain gets eaten by the quadratic penalty. <a href="#lightbox-compound_wealth_growth-png-2" style="display: block; width: 80%; margin: 0 auto; padding: 1.5rem 0; text-decoration: none;">
  <picture class="img-lightbox">
    
    <source media="(max-width: 768px)" 
            srcset="https://static.philippdubach.com/cdn-cgi/image/width=320,quality=80,format=webp/compound_wealth_growth.png 320w,
                    https://static.philippdubach.com/cdn-cgi/image/width=480,quality=80,format=webp/compound_wealth_growth.png 480w,
                    https://static.philippdubach.com/cdn-cgi/image/width=640,quality=80,format=webp/compound_wealth_growth.png 640w,
                    https://static.philippdubach.com/cdn-cgi/image/width=960,quality=80,format=webp/compound_wealth_growth.png 960w,
                    https://static.philippdubach.com/cdn-cgi/image/width=1200,quality=80,format=webp/compound_wealth_growth.png 1200w"
            sizes="80vw">
    
    
    <source media="(max-width: 1024px)" 
            srcset="https://static.philippdubach.com/cdn-cgi/image/width=768,quality=80,format=webp/compound_wealth_growth.png 768w,
                    https://static.philippdubach.com/cdn-cgi/image/width=1024,quality=80,format=webp/compound_wealth_growth.png 1024w,
                    https://static.philippdubach.com/cdn-cgi/image/width=1440,quality=80,format=webp/compound_wealth_growth.png 1440w"
            sizes="80vw">
    
    
    <source media="(min-width: 1025px)" 
            srcset="https://static.philippdubach.com/cdn-cgi/image/width=1200,quality=80,format=webp/compound_wealth_growth.png 1200w,
                    https://static.philippdubach.com/cdn-cgi/image/width=1600,quality=80,format=webp/compound_wealth_growth.png 1600w,
                    https://static.philippdubach.com/cdn-cgi/image/width=2000,quality=80,format=webp/compound_wealth_growth.png 2000w"
            sizes="80vw">
    
    
    <img src="https://static.philippdubach.com/cdn-cgi/image/width=1200,quality=80/compound_wealth_growth.png" 
         alt="Line chart showing $100 invested at 10% arithmetic return over 30 years at four volatility levels: 0% vol reaches $1,745, 15% vol reaches $1,280, 30% vol reaches $498, and 50% vol loses most of the original investment" 
         class=""
         width="1200"
         height="630"
         loading="lazy"
         decoding="async"
         style="width: 100%; height: auto; display: block;">
  </picture>
</a>


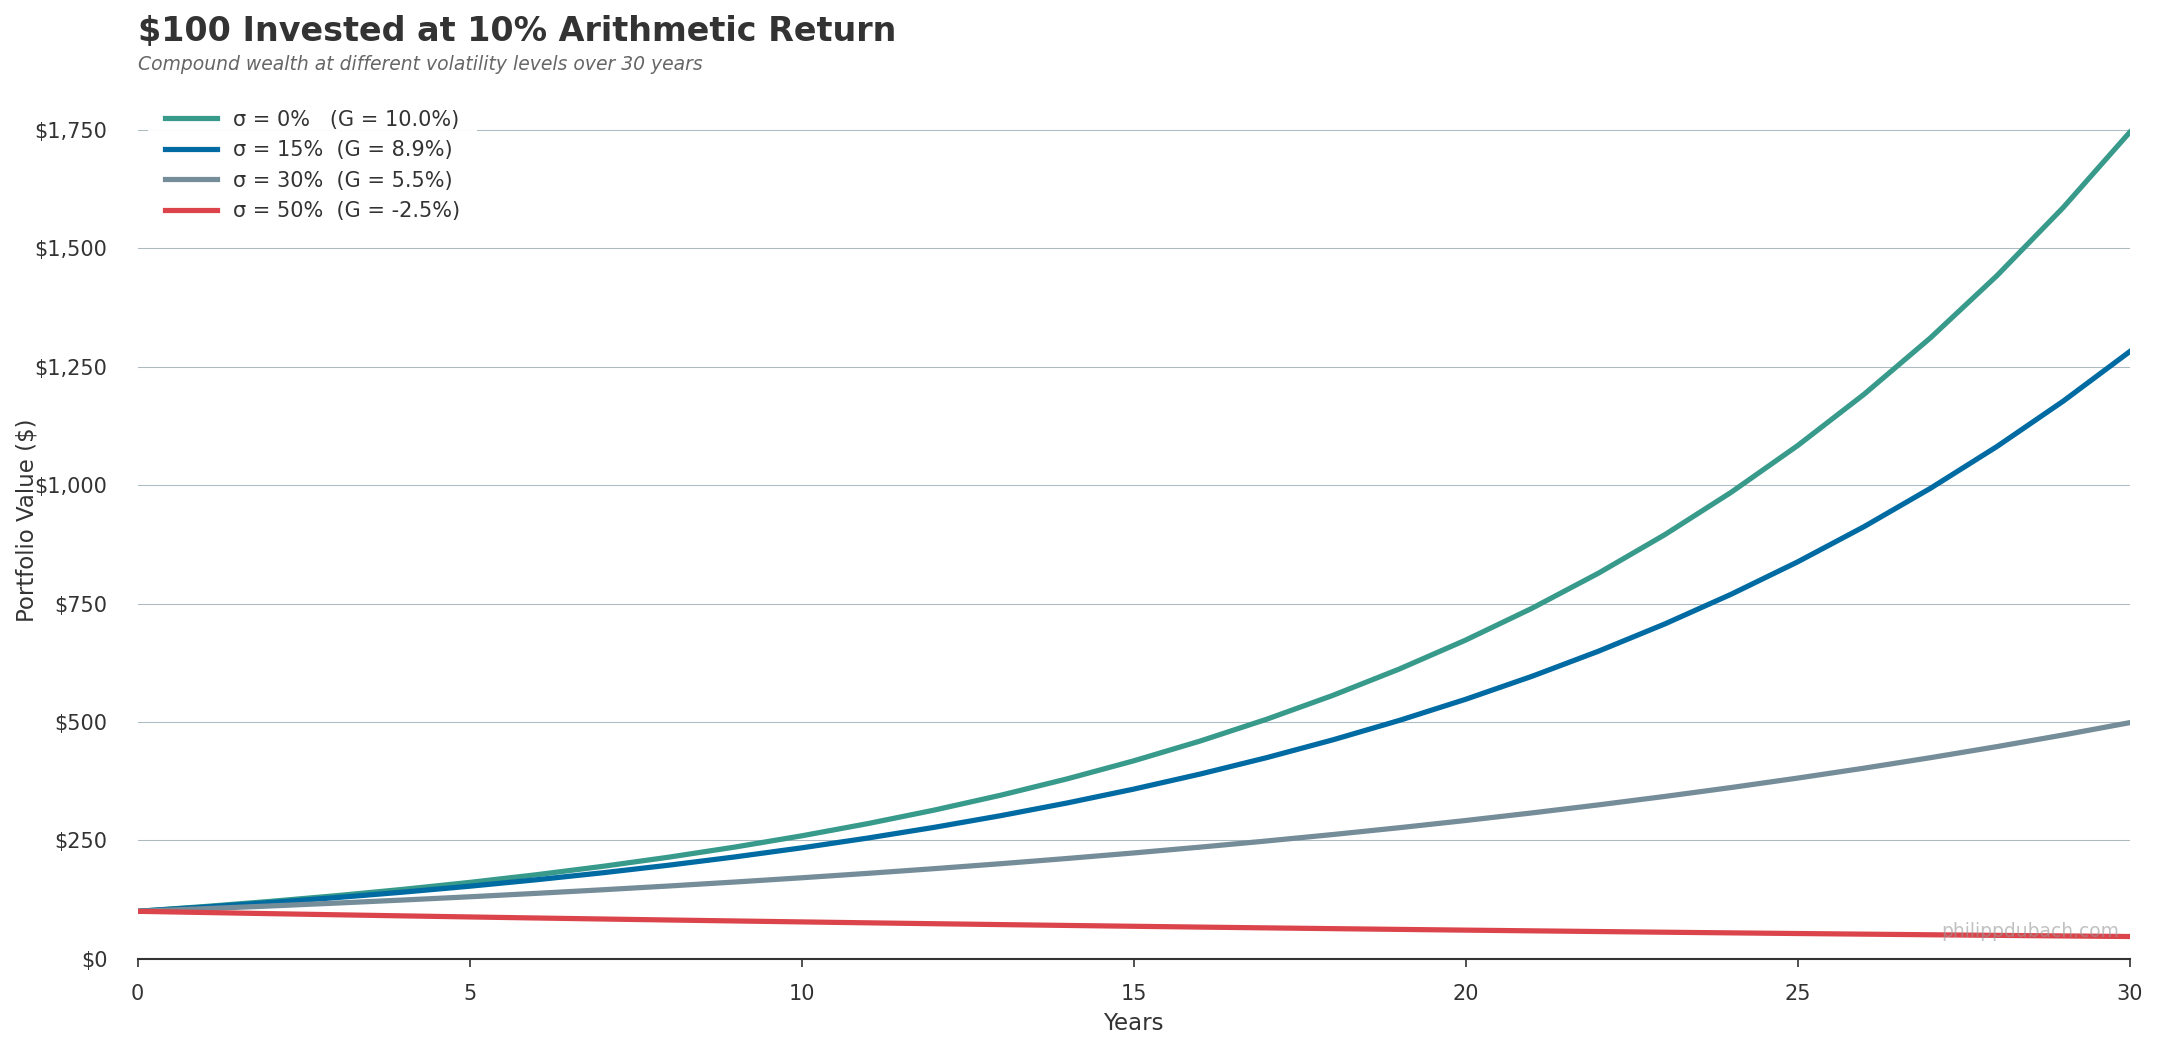
 Same 10% arithmetic return, different volatility. After 30 years, the zero-volatility path reaches $1,745. At 15% vol, $1,280. At 30%, $498. At 50% vol you have lost more than half your money despite averaging +10% per year. 

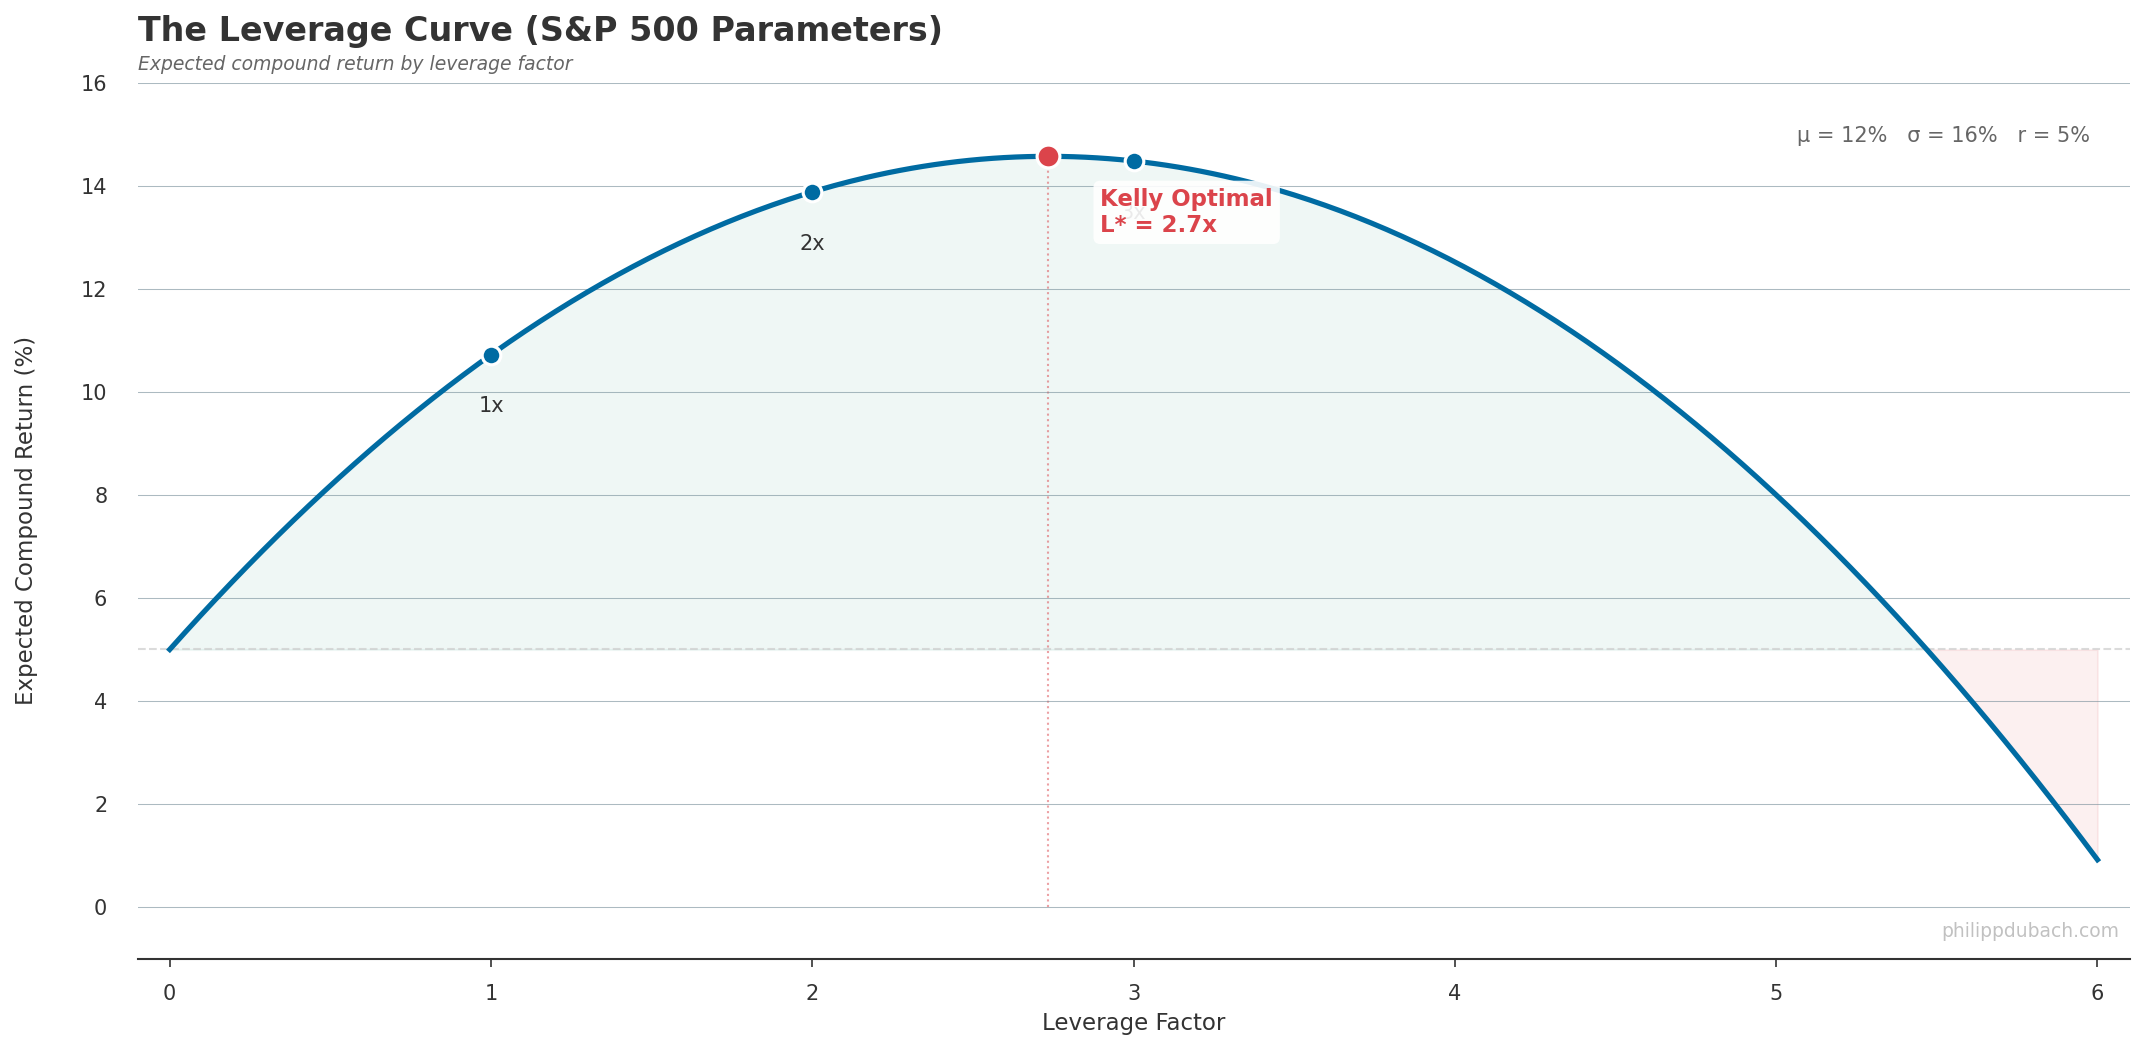
Now apply leverage. If you lever an asset by factor L, the arithmetic return scales linearly (Lμ) but the variance drain scales quadratically (½L²σ²). The compound return becomes:

$$G(L) ≈ r + L(μ − r) − ½L²σ²$$

Take the derivative, set to zero. The leverage that maximizes compound wealth:

$$L^{\ast} = (μ − r) / σ²$$


For the S&P 500 with roughly 7% excess return and 16% vol, L* comes out to about 2.7x.
<a href="#lightbox-leverage_curve-png-4" style="display: block; width: 80%; margin: 0 auto; padding: 1.5rem 0; text-decoration: none;">
  <picture class="img-lightbox">
    
    <source media="(max-width: 768px)" 
            srcset="https://static.philippdubach.com/cdn-cgi/image/width=320,quality=80,format=webp/leverage_curve.png 320w,
                    https://static.philippdubach.com/cdn-cgi/image/width=480,quality=80,format=webp/leverage_curve.png 480w,
                    https://static.philippdubach.com/cdn-cgi/image/width=640,quality=80,format=webp/leverage_curve.png 640w,
                    https://static.philippdubach.com/cdn-cgi/image/width=960,quality=80,format=webp/leverage_curve.png 960w,
                    https://static.philippdubach.com/cdn-cgi/image/width=1200,quality=80,format=webp/leverage_curve.png 1200w"
            sizes="80vw">
    
    
    <source media="(max-width: 1024px)" 
            srcset="https://static.philippdubach.com/cdn-cgi/image/width=768,quality=80,format=webp/leverage_curve.png 768w,
                    https://static.philippdubach.com/cdn-cgi/image/width=1024,quality=80,format=webp/leverage_curve.png 1024w,
                    https://static.philippdubach.com/cdn-cgi/image/width=1440,quality=80,format=webp/leverage_curve.png 1440w"
            sizes="80vw">
    
    
    <source media="(min-width: 1025px)" 
            srcset="https://static.philippdubach.com/cdn-cgi/image/width=1200,quality=80,format=webp/leverage_curve.png 1200w,
                    https://static.philippdubach.com/cdn-cgi/image/width=1600,quality=80,format=webp/leverage_curve.png 1600w,
                    https://static.philippdubach.com/cdn-cgi/image/width=2000,quality=80,format=webp/leverage_curve.png 2000w"
            sizes="80vw">
    
    
    <img src="https://static.philippdubach.com/cdn-cgi/image/width=1200,quality=80/leverage_curve.png" 
         alt="The leverage curve for S&amp;P 500 parameters showing compound return peaking at Kelly optimal leverage L*=2.7x, with labeled points at 1x, 2x, and 3x leverage. Returns decline beyond the Kelly optimum and eventually turn negative" 
         class=""
         width="1200"
         height="630"
         loading="lazy"
         decoding="async"
         style="width: 100%; height: auto; display: block;">
  </picture>
</a>


 This is the [Kelly criterion](https://en.wikipedia.org/wiki/Kelly_criterion) (_which you might know from utility theory or gambling heuristics but in fact, as we see here, it falls straight out of the variance tax formula._) Beyond Kelly, every dollar of additional leverage costs more in variance drain than it earns in expected return. The curve bends over and eventually goes negative. In practice, most practitioners use "half-Kelly" — sizing positions at L*/2 — because the formula assumes you know μ and σ precisely, and you don't. Estimation error in either parameter can push you past the peak and onto the losing side of the curve. Half-Kelly sacrifices roughly 25% of the theoretical growth rate but dramatically reduces drawdown risk.
<a href="#lightbox-UPRO_factsheet-png-5" style="display: block; width: 80%; margin: 0 auto; padding: 1.5rem 0; text-decoration: none;">
  <picture class="img-lightbox">
    
    <source media="(max-width: 768px)" 
            srcset="https://static.philippdubach.com/cdn-cgi/image/width=320,quality=80,format=webp/UPRO_factsheet.png 320w,
                    https://static.philippdubach.com/cdn-cgi/image/width=480,quality=80,format=webp/UPRO_factsheet.png 480w,
                    https://static.philippdubach.com/cdn-cgi/image/width=640,quality=80,format=webp/UPRO_factsheet.png 640w,
                    https://static.philippdubach.com/cdn-cgi/image/width=960,quality=80,format=webp/UPRO_factsheet.png 960w,
                    https://static.philippdubach.com/cdn-cgi/image/width=1200,quality=80,format=webp/UPRO_factsheet.png 1200w"
            sizes="80vw">
    
    
    <source media="(max-width: 1024px)" 
            srcset="https://static.philippdubach.com/cdn-cgi/image/width=768,quality=80,format=webp/UPRO_factsheet.png 768w,
                    https://static.philippdubach.com/cdn-cgi/image/width=1024,quality=80,format=webp/UPRO_factsheet.png 1024w,
                    https://static.philippdubach.com/cdn-cgi/image/width=1440,quality=80,format=webp/UPRO_factsheet.png 1440w"
            sizes="80vw">
    
    
    <source media="(min-width: 1025px)" 
            srcset="https://static.philippdubach.com/cdn-cgi/image/width=1200,quality=80,format=webp/UPRO_factsheet.png 1200w,
                    https://static.philippdubach.com/cdn-cgi/image/width=1600,quality=80,format=webp/UPRO_factsheet.png 1600w,
                    https://static.philippdubach.com/cdn-cgi/image/width=2000,quality=80,format=webp/UPRO_factsheet.png 2000w"
            sizes="80vw">
    
    
    <img src="https://static.philippdubach.com/cdn-cgi/image/width=1200,quality=80/UPRO_factsheet.png" 
         alt="Extract of ProShares UltraPro S&amp;P 500 Factsheet Total Return" 
         class=""
         width="1200"
         height="630"
         loading="lazy"
         decoding="async"
         style="width: 100%; height: auto; display: block;">
  </picture>
</a>


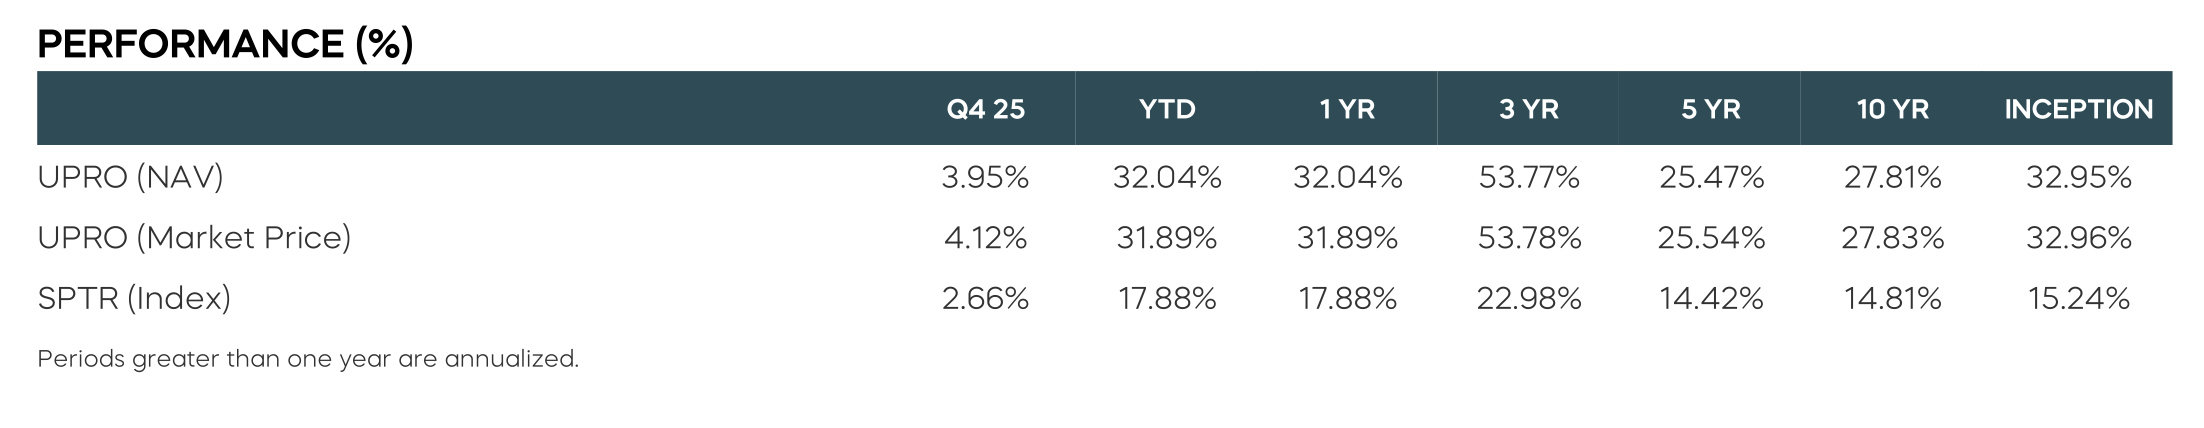
You can see this play out in practice. [ProShares UPRO](https://www.proshares.com/our-etfs/leveraged-and-inverse/upro), the 3x S&P 500 ETF, has returned roughly 28% annualized over the past decade during one of the strongest bull markets in history. The S&P 500 compounded at about 10% over the same period. Linear 3x leverage would imply roughly 30%. Variance drain accounts for the gap, and that was in a favorable environment. In 2022, when the S&P fell about 19%, UPRO dropped 70%. The effect is even starker in higher-volatility underlyings: [ProShares TQQQ](https://www.proshares.com/our-etfs/leveraged-and-inverse/tqqq), the 3x Nasdaq-100 ETF, sat roughly flat from its 2021 highs through early 2025 while the unlevered QQQ had long since recovered — a textbook case of variance drain overwhelming the leverage premium in a choppy market. 

The same half-sigma-squared shows up across finance. It is why stock prices follow [log-normal distributions](https://en.wikipedia.org/wiki/Log-normal_distribution), not normal ones. Why put options cost more than equidistant calls. Why the [Black-Scholes](https://en.wikipedia.org/wiki/Black%E2%80%93Scholes_model) d₁ and d₂ terms carry a ½σ²t adjustment. Why a $100 stock's true geometric midpoint between $150 up and $50 down is not $100 but $86.60, because ln(150/100) = ln(100/66.67). Wherever returns compound and volatility is nonzero, the variance tax is being collected.


---

## Frequently Asked Questions

### What is variance drain (volatility drag)?

Variance drain is the gap between an investment's arithmetic mean return and its compound (geometric) growth rate. It equals approximately ½σ², where σ is the volatility of returns. Higher volatility means a larger gap between the average return you see reported and the actual wealth you accumulate.

### How does leverage amplify volatility drag?

Leverage L scales arithmetic return linearly (Lμ) but scales variance drain quadratically (½L²σ²). Doubling leverage quadruples the drag. This is why leveraged ETFs can underperform their target multiple over time, especially in volatile markets.

### What is the Kelly criterion and how does it relate to variance drain?

The Kelly criterion gives the leverage ratio that maximizes compound growth: L* = (μ − r) / σ². It falls directly out of the variance drain formula — it is the point where the marginal return from additional leverage exactly equals the marginal cost of additional variance drain.

### Why do practitioners use half-Kelly?

Full Kelly assumes perfect knowledge of expected return (μ) and volatility (σ). In practice, both are estimated with error. Half-Kelly — sizing at L*/2 — sacrifices about 25% of theoretical growth but dramatically reduces the risk of overleveraging due to estimation error.

### Is volatility drag a real force or a mathematical artifact?

It is a mathematical relationship, not a physical force — the geometric mean is always less than or equal to the arithmetic mean (AM-GM inequality). But the P&L consequences are entirely real: two portfolios with the same average return but different volatilities will produce different terminal wealth.


---

*Philipp D. Dubach — [http://philippdubach.com/](http://philippdubach.com/) — 2026*