For the first decade of mobile games made more money than everything else combined. Clash of Clans and Candy Crush built empires on freemium. King went public. Supercell sold for $10 billion. That changed in 2025. 
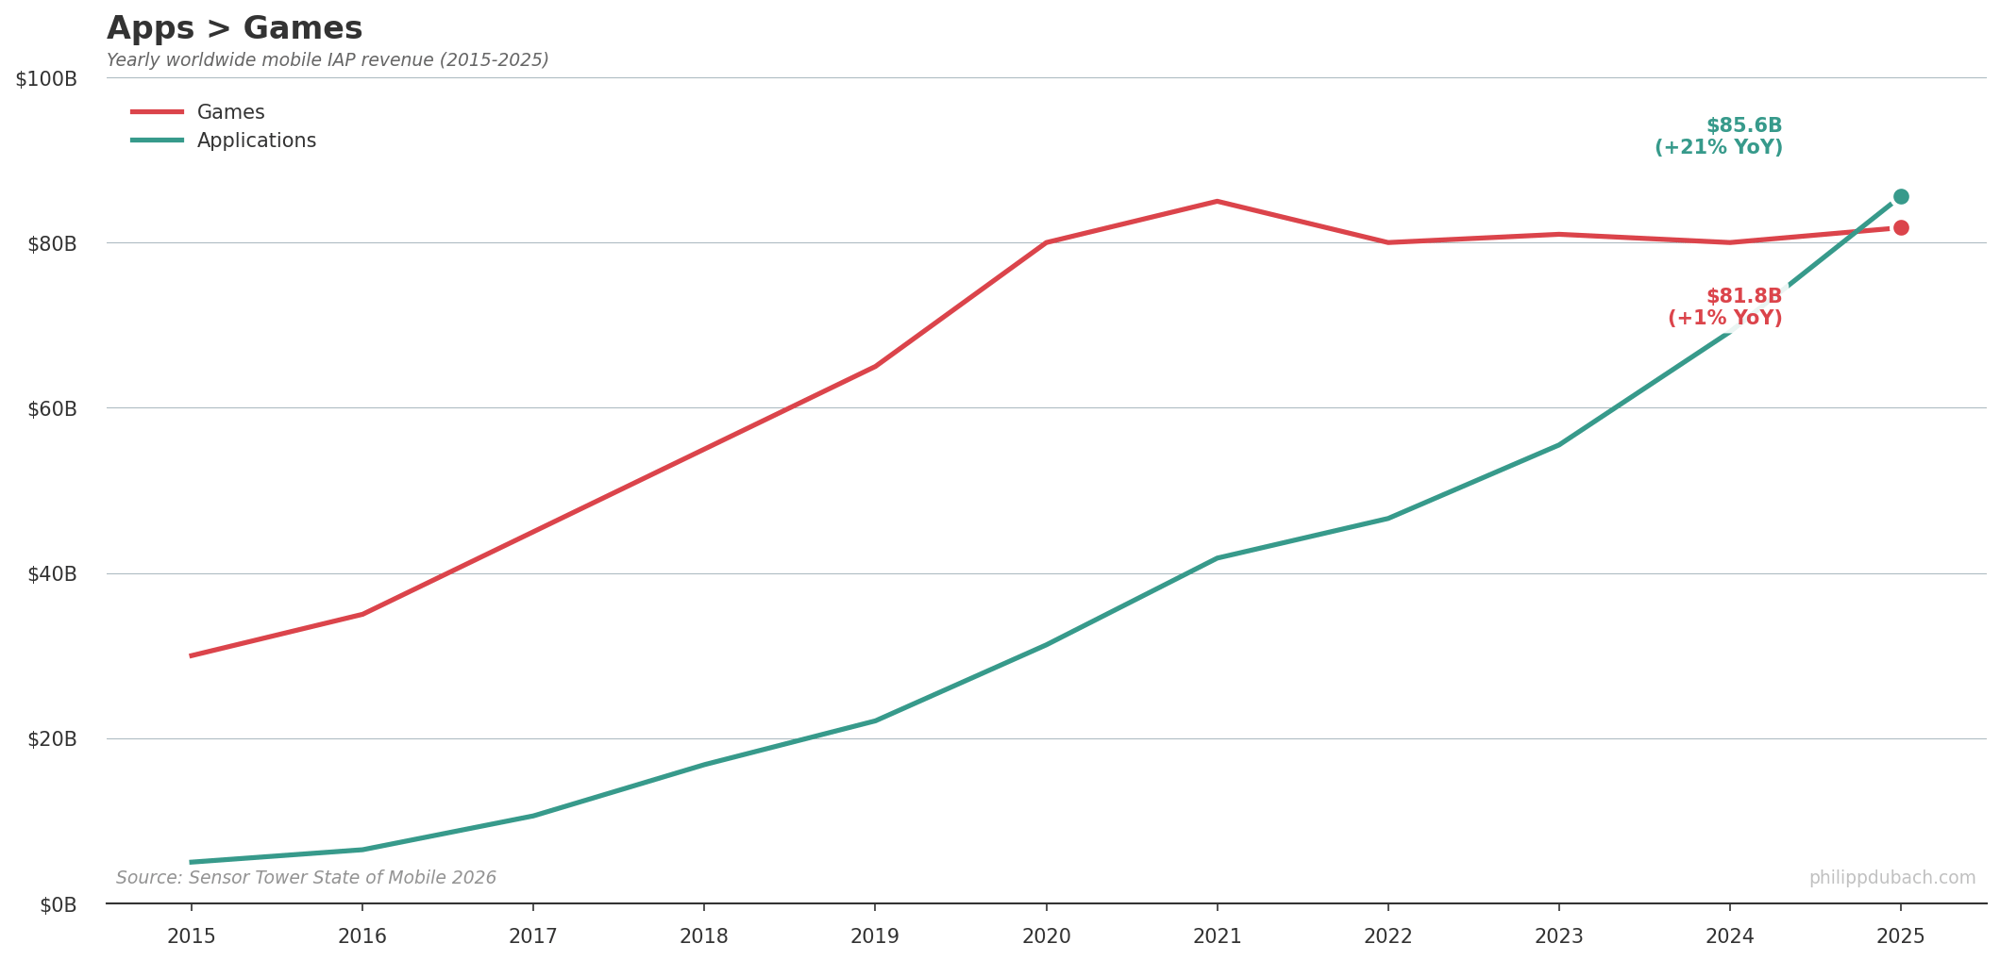 Sensor Tower’s State of Mobile 2026 report confirms what had been building for years: non-game applications now generate more in-app revenue than games. Apps crossed $85.6 billion in 2025, up 21% year-over-year. Games managed $81.8 billion, barely moving from the year before.
Games peaked in 2021 and flatlined. Apps kept compounding. Subscriptions, which seemed like a novelty in 2018, became the dominant business model for cloud storage, language learning, and now AI. 
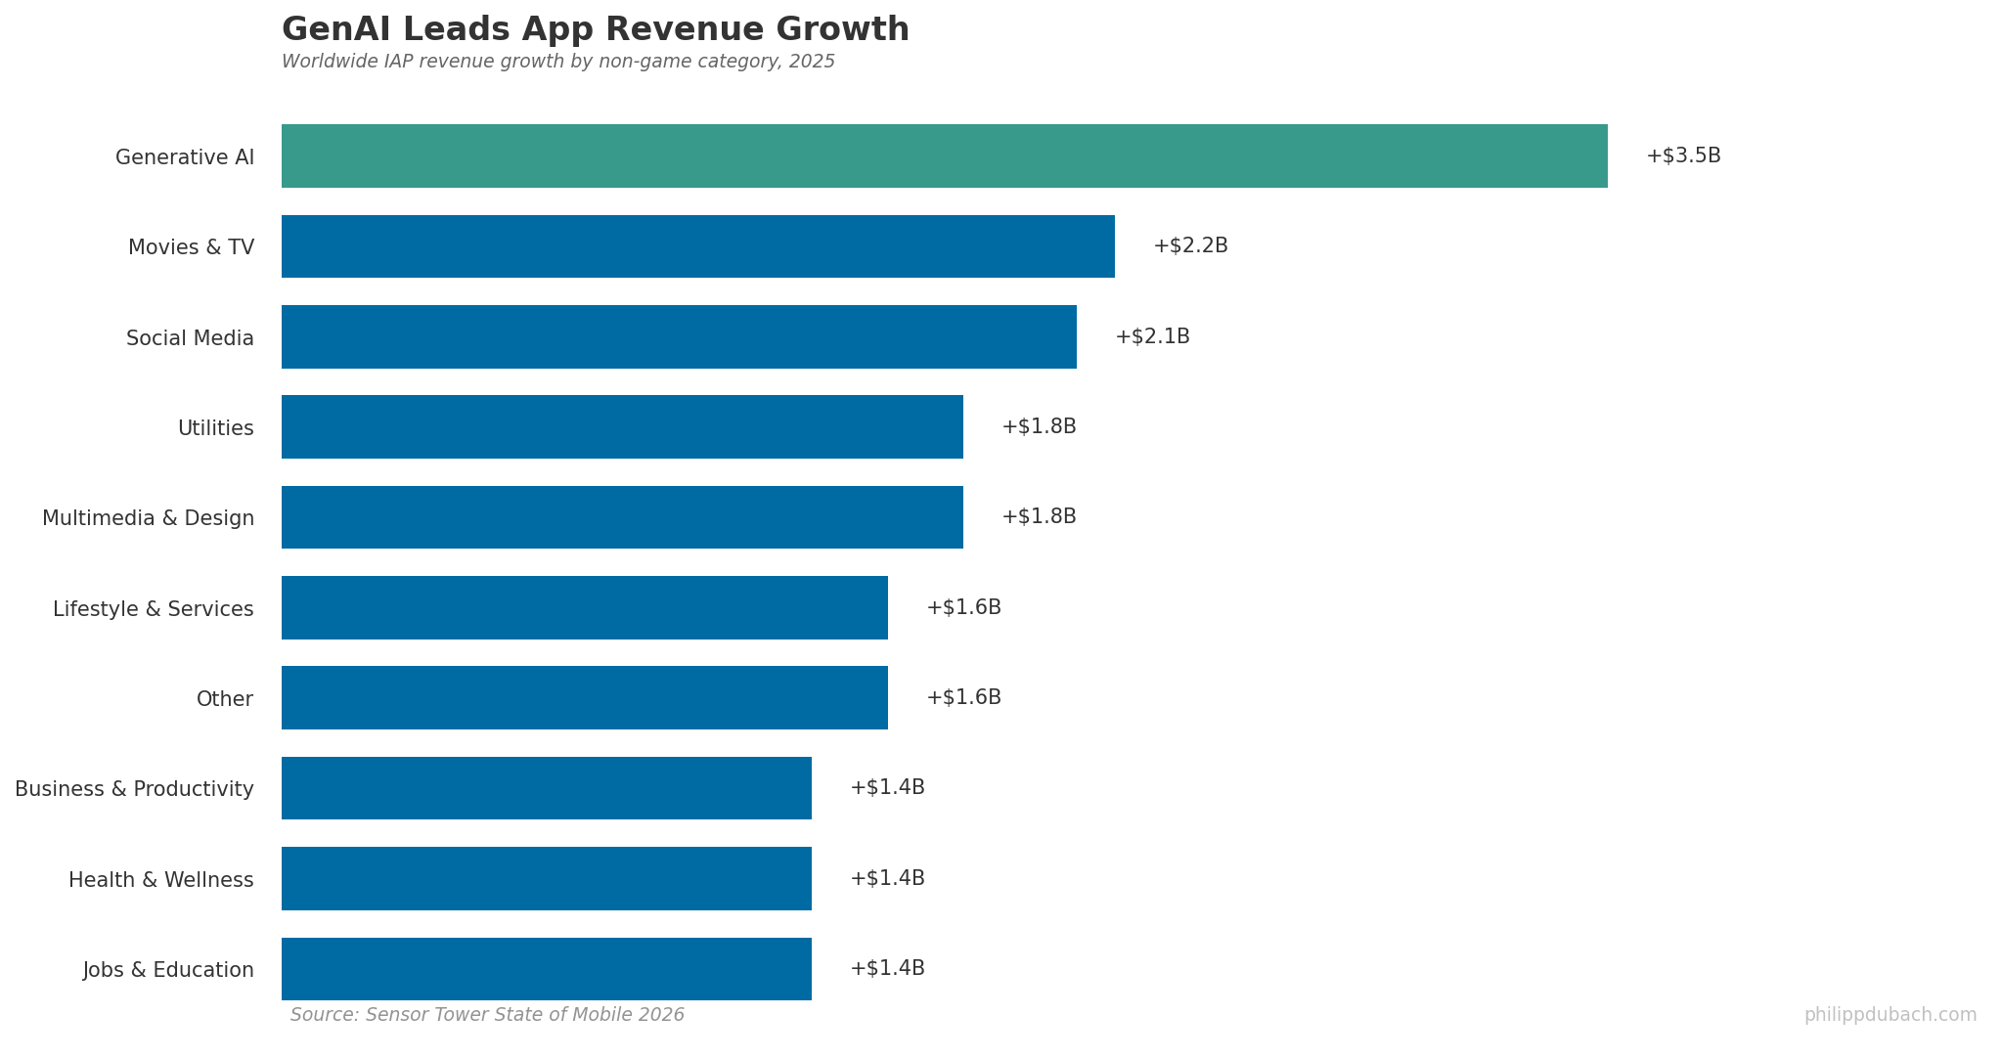 Generative AI was the biggest contributor. The category added $3.5 billion in IAP revenue in 2025, more than Movies & TV ($2.2B) or Social Media ($2.1B). It went from near-zero in 2022 to the top growth category in three years.
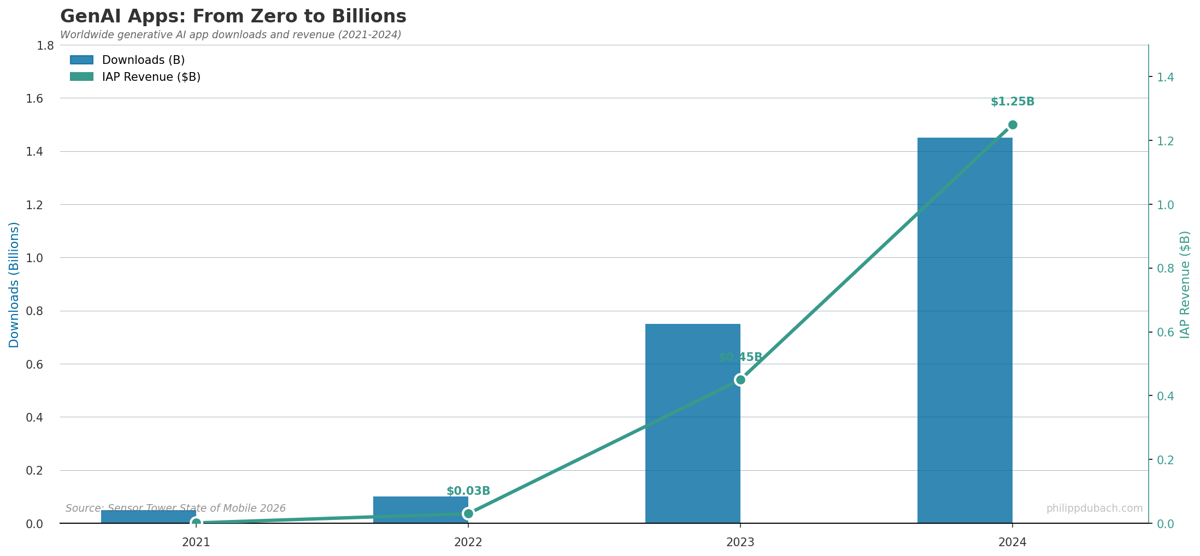
 GenAI apps went from 50 million downloads in 2021 to 1.45 billion in 2024. Revenue jumped from essentially nothing to $1.25 billion. ChatGPT alone accounts for 40% of the category’s consumer spend. This is just in-app purchases and does not count subscriptions billed outside the app store or enterprise contracts.
The demographics are interesting: AI app users look nothing like the broader internet population. 
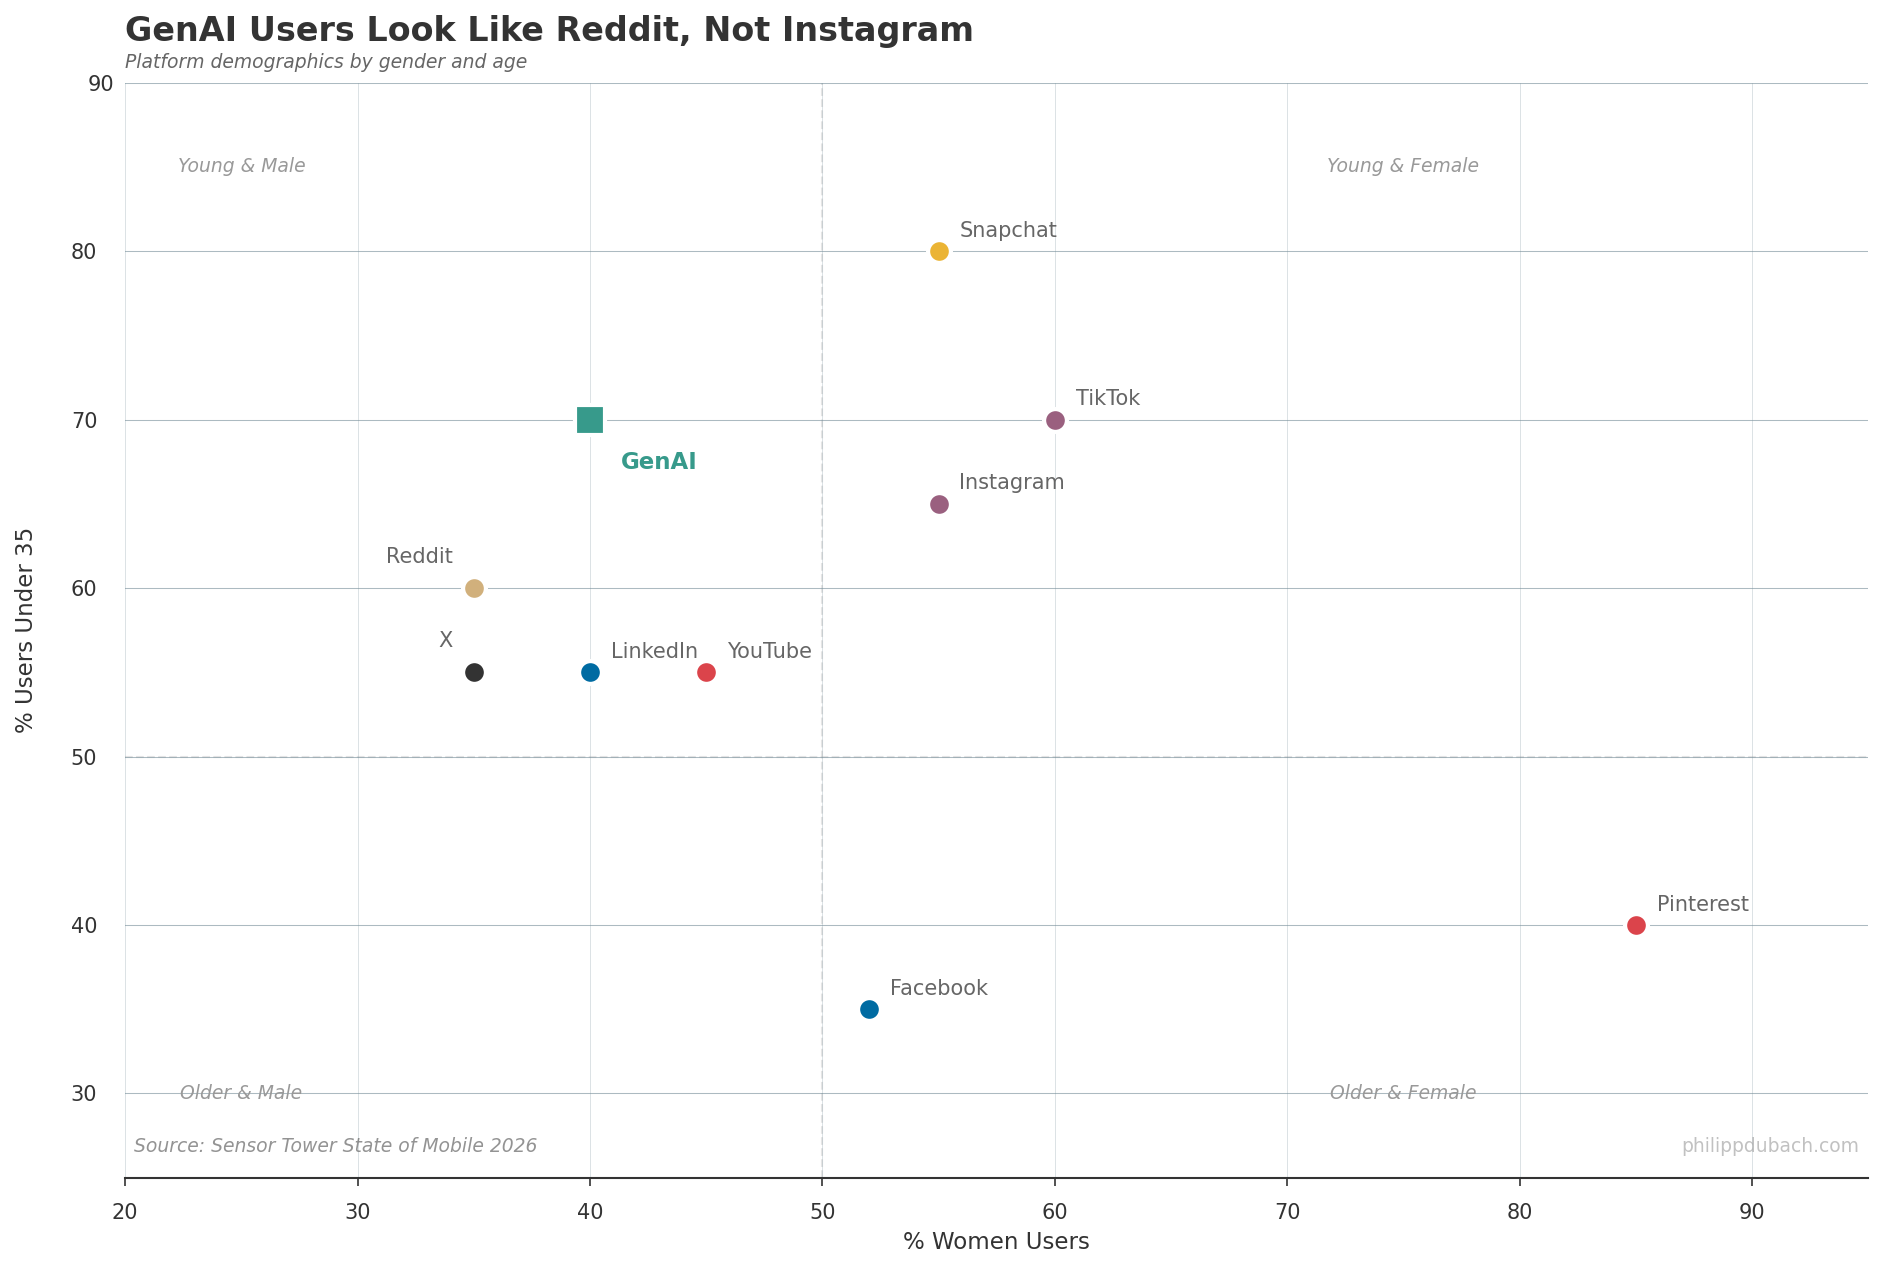 GenAI users cluster with Reddit and X. Young, male, tech-adjacent. They look nothing like Instagram (young women) or Pinterest (older women) or even Facebook (everyone’s parents). The AI audience is still a niche, even as revenue scales.
This explains where AI companies advertise: 
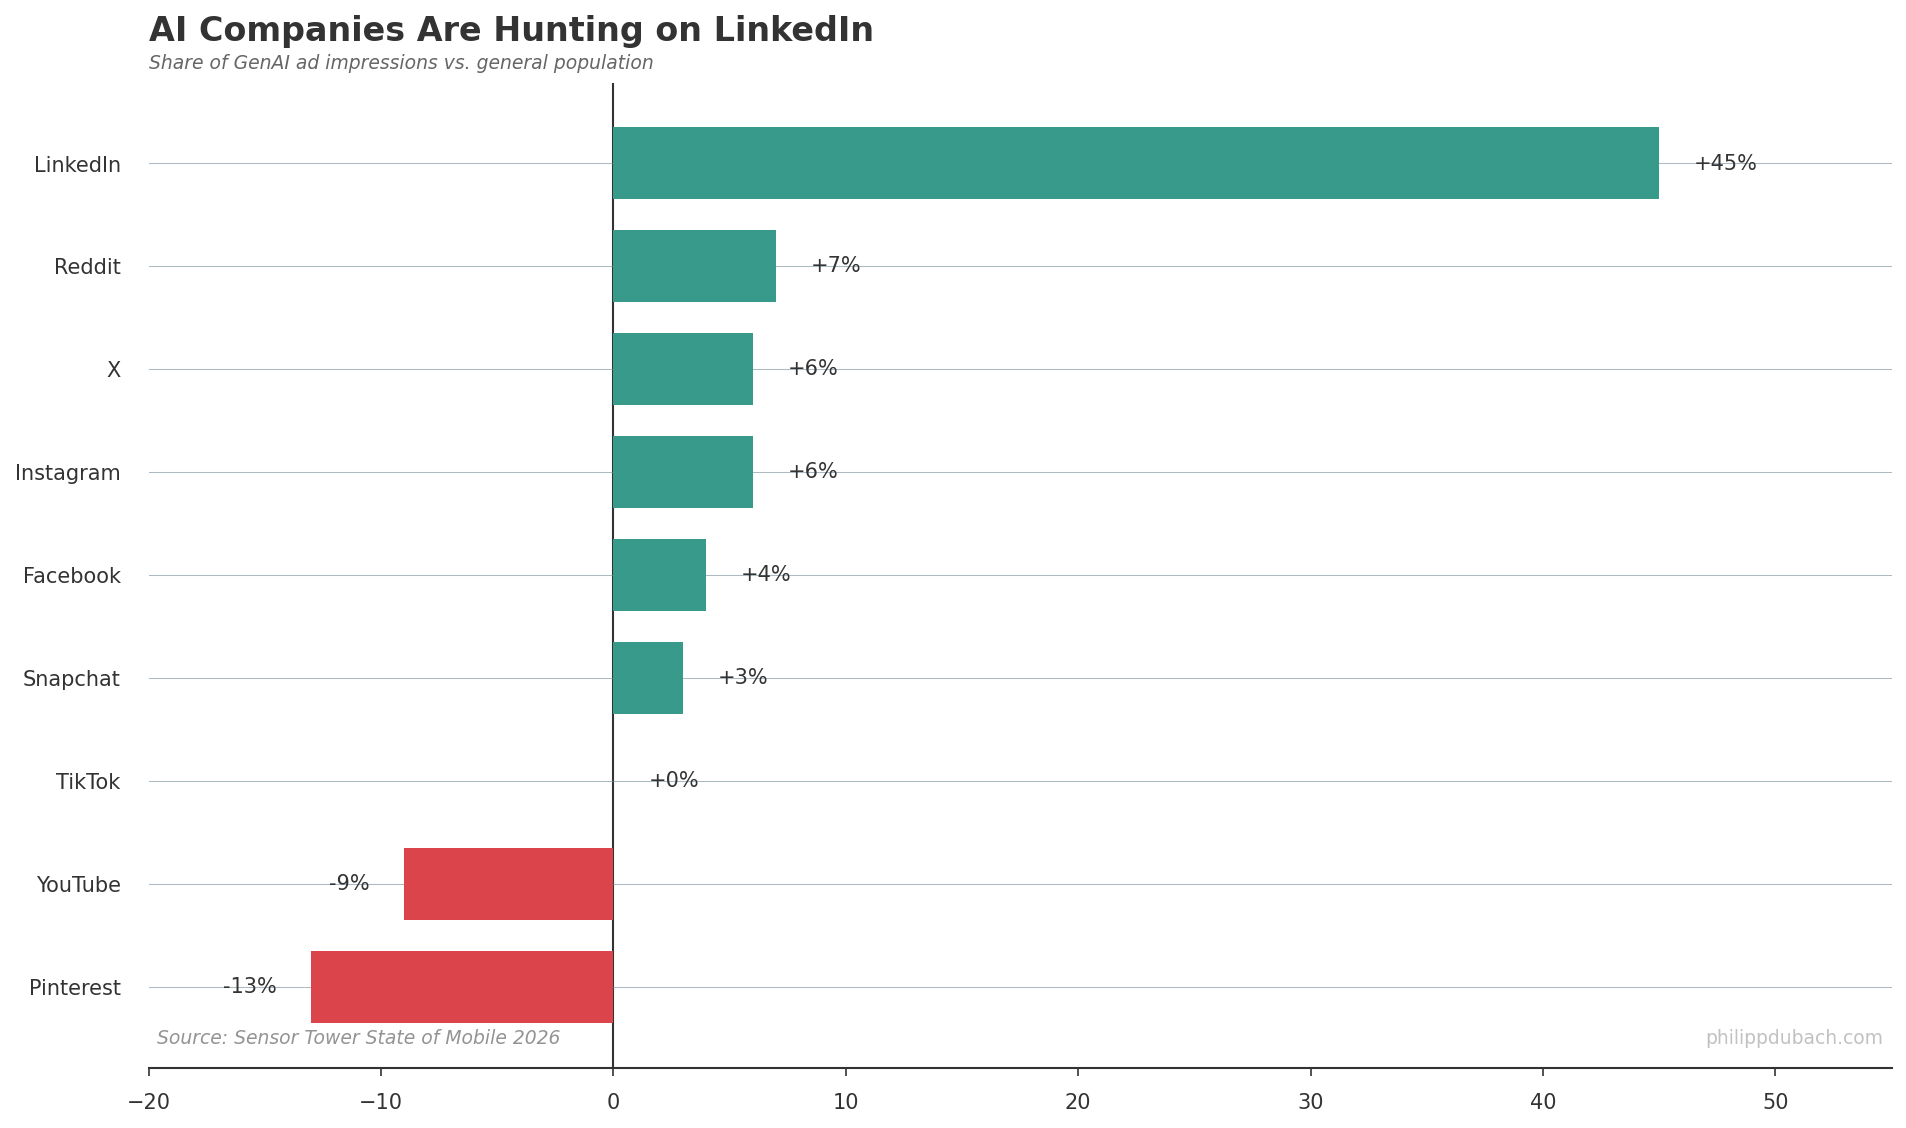 LinkedIn gets 45% more GenAI ad impressions than its share of the general population would suggest. Pinterest and YouTube get less. The AI marketing playbook is simple: find professionals, not consumers.
One place where AI has found consumers: shopping. 
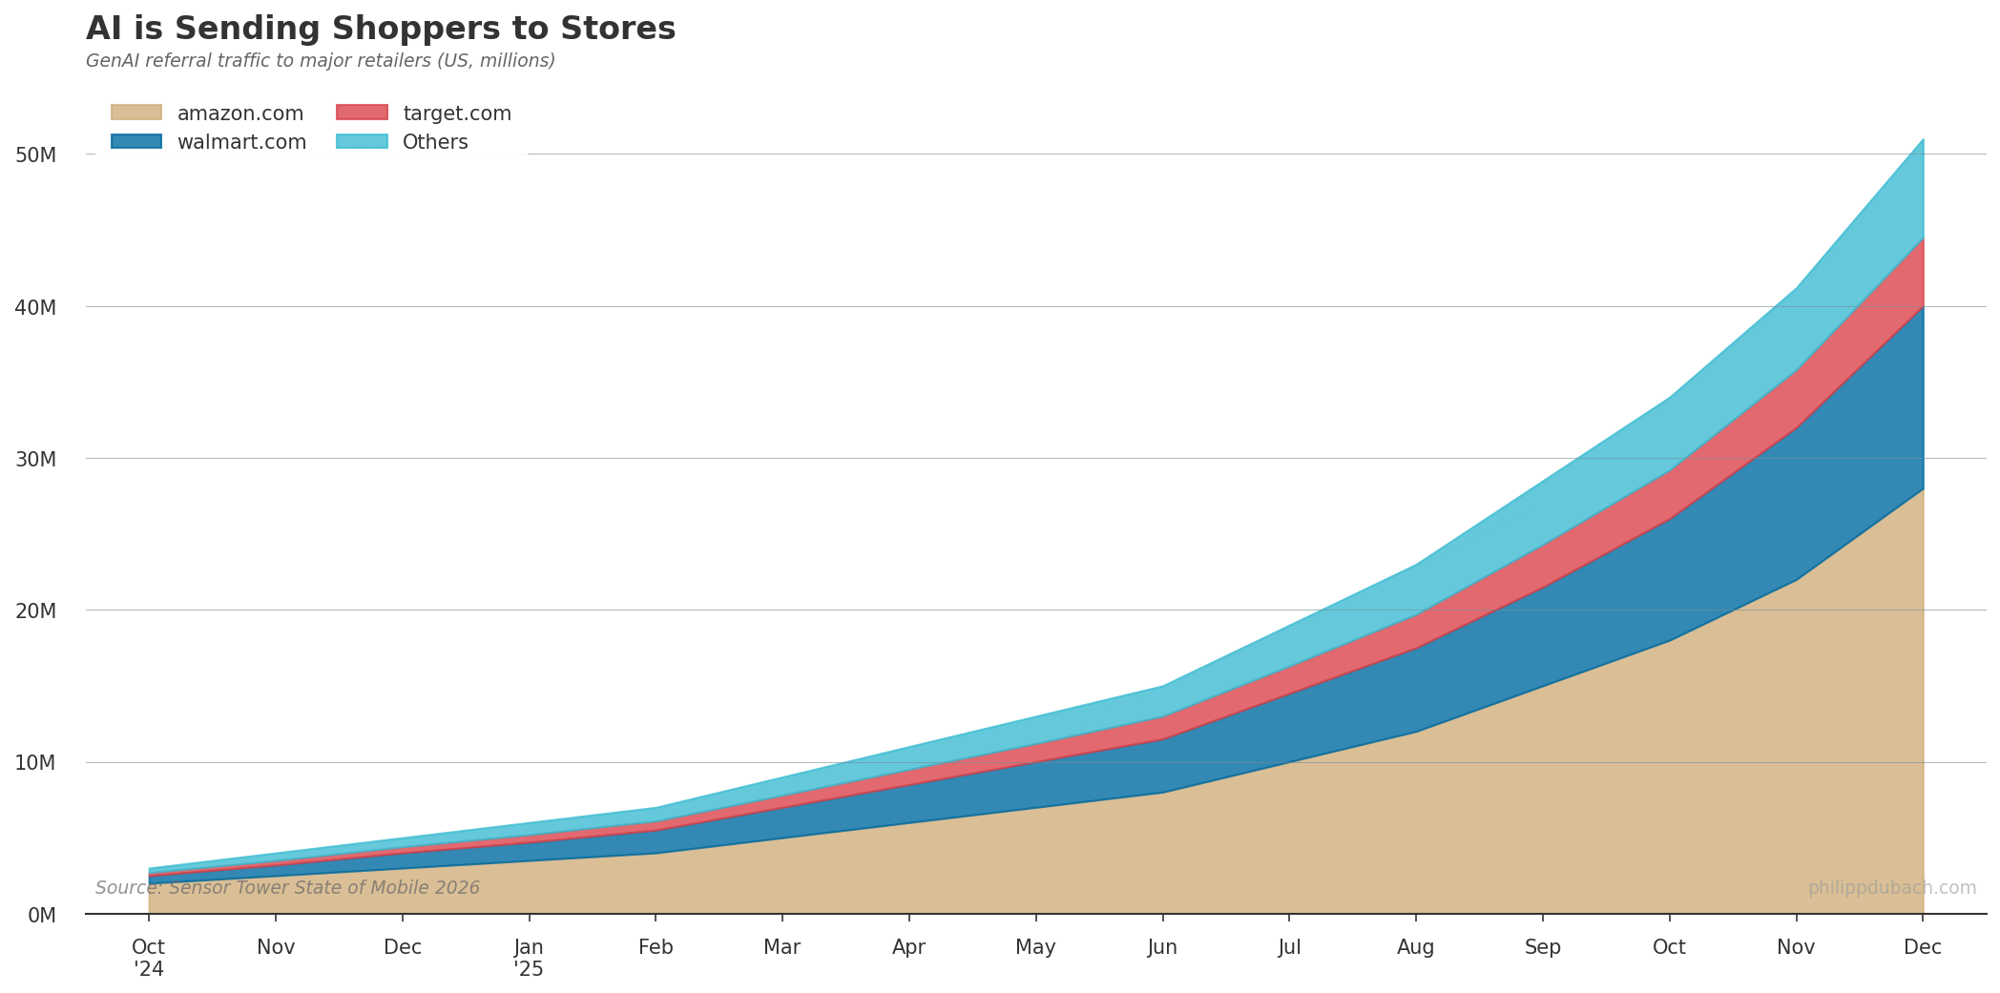 Referral traffic from AI tools to major retailers grew roughly 7x between October 2024 and December 2025. People are asking ChatGPT what to buy, and then buying it. Amazon captures the largest share, but Walmart, Target, and Home Depot have all seen triple-digit percentage growth in AI-driven traffic. Still less than 1% of total retail traffic. But growing fast.
One pattern stands out: 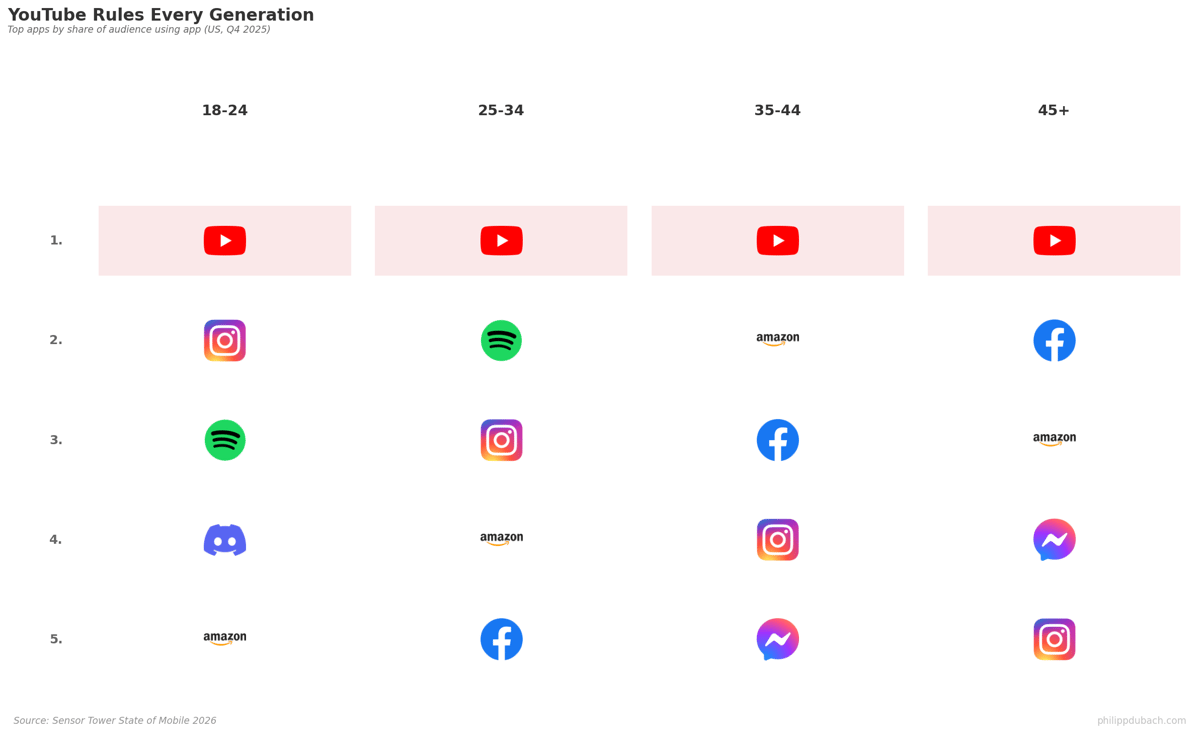
 YouTube is the top app across every age demographic. Every single one. 18-24, 25-34, 35-44, 45+. No other app has achieved this. Not TikTok (appears for youngest and oldest, vanishes in the middle). Not Instagram (fades with age). Not Facebook (rises with age). YouTube alone spans generations.
Finally, Waymo: 
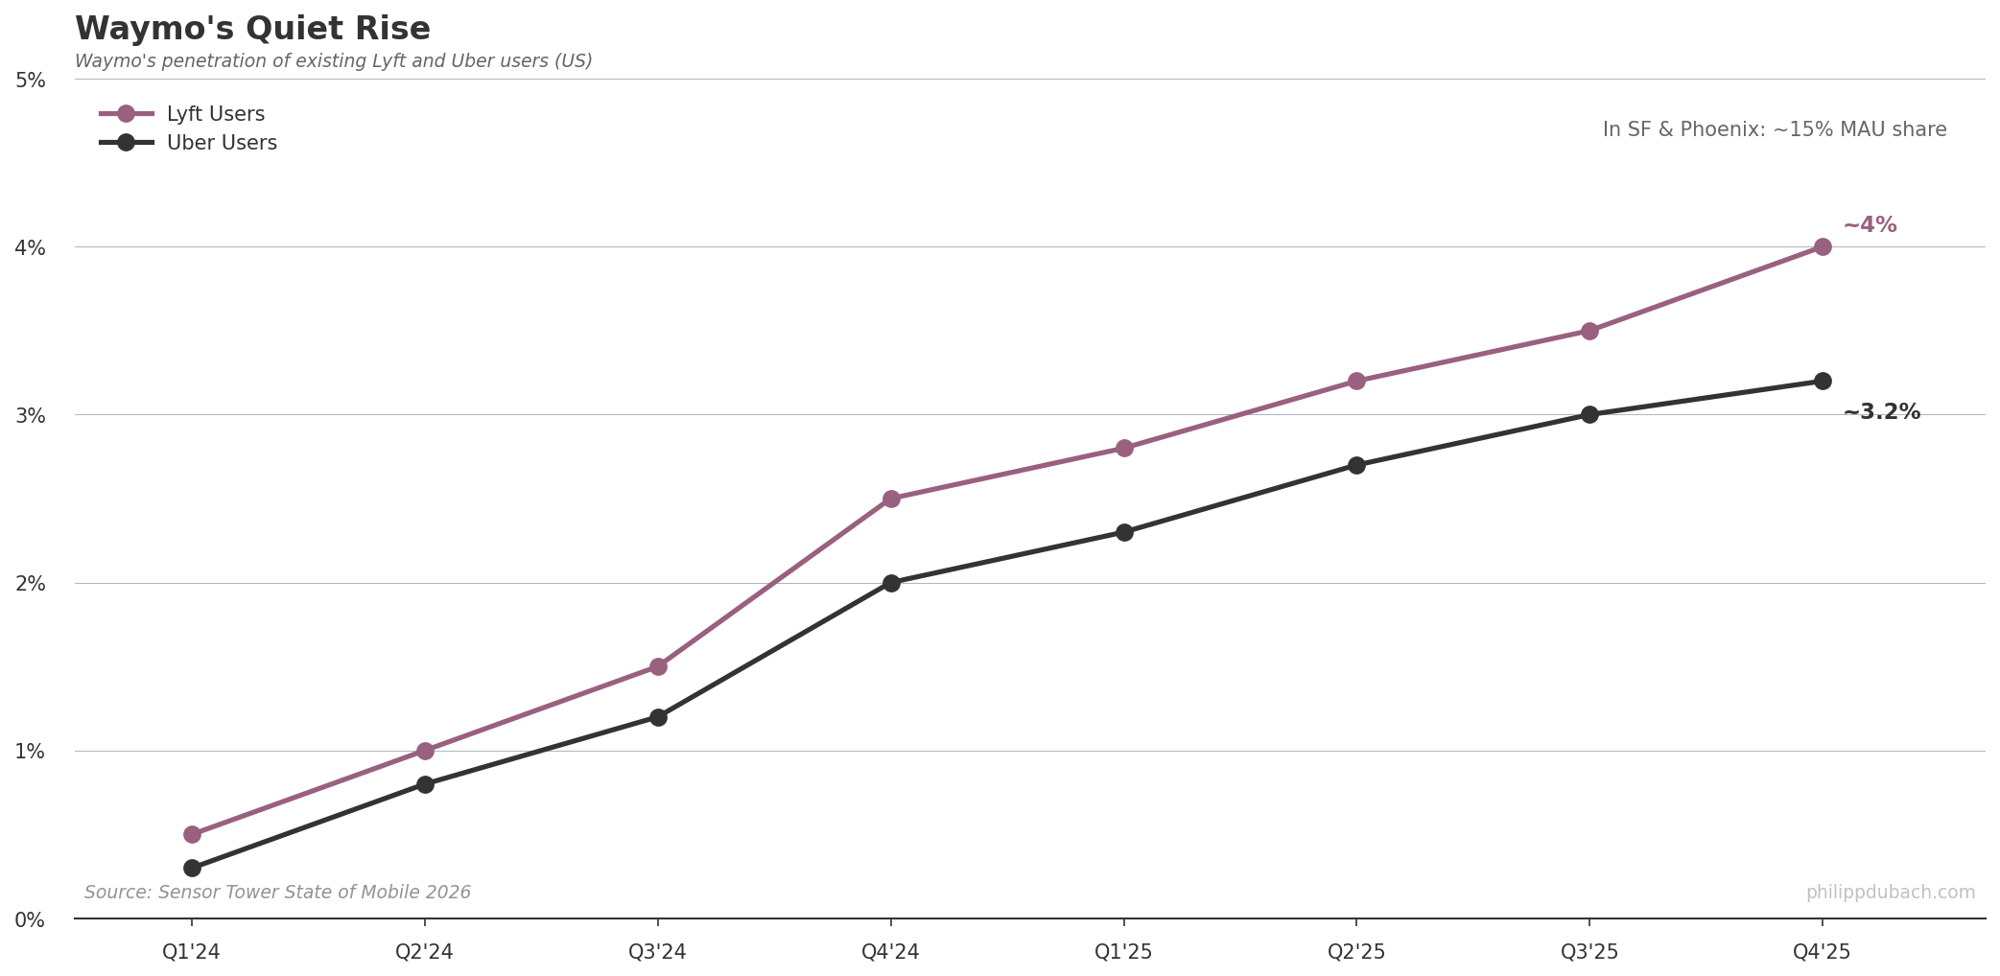 Waymo accounts for about 4% of Lyft users and 3% of Uber users nationally, despite operating in only a handful of cities. In its active markets (San Francisco, Phoenix), market share is closer to 15%. The company has driven 127 million autonomous miles and tripled its ride volume to 15 million trips in 2025.
Mobile is no longer a platform question. It is a distribution question. The winners so far: AI companies targeting professionals, YouTube serving everyone, and autonomous vehicles growing quietly in the background.